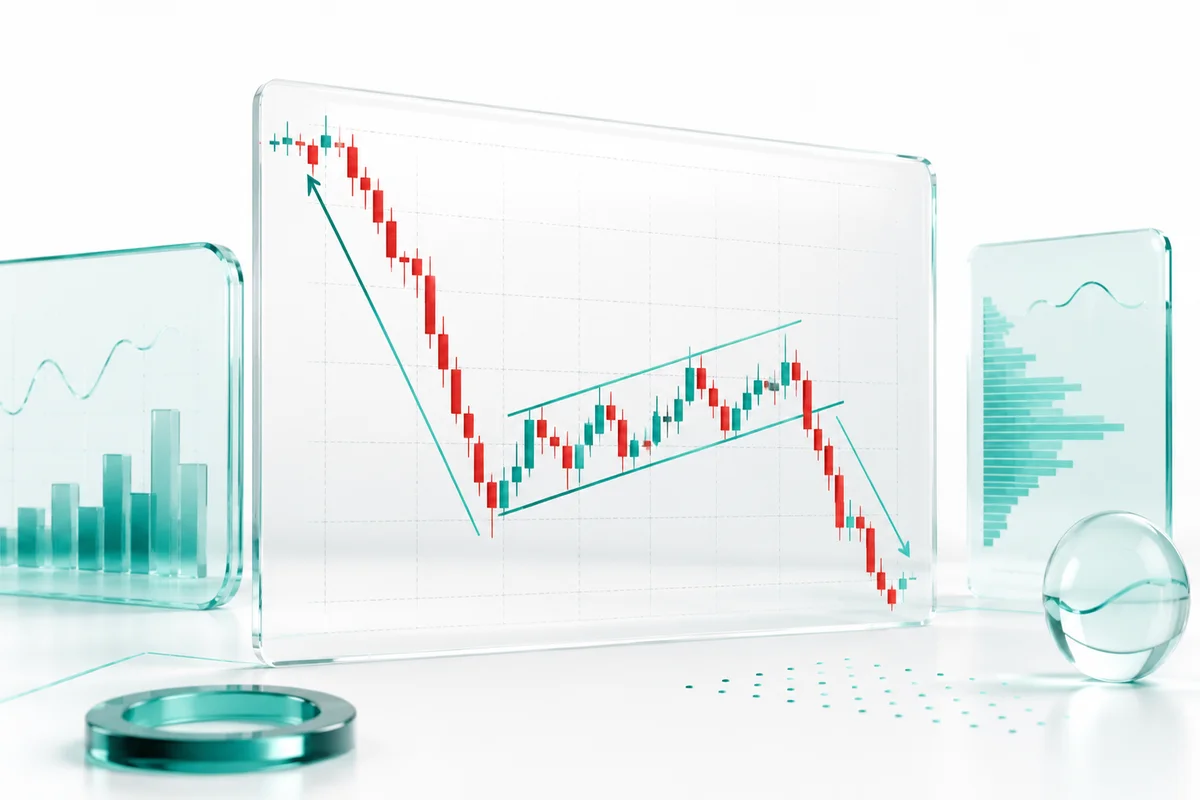
A bearish flag is a technical chart pattern that signals a continuation of a downtrend after price forms a small counter-trend consolidation. The pattern appears after a sharp decline called the flagpole, followed by a small sideways or slightly upward move called the flag, then a breakdown below support. It is widely used by crypto and stock traders to spot short selling or fresh sell entries. Understanding the bearish flag first will help you filter valid setups and avoid false breakdown traps.
Key Points
- Definition: A bearish flag is a continuation pattern signaling that price likely falls after a short consolidation.
- Anatomy: It consists of a sharp falling flagpole and a flag moving against the trend.
- Confirmation: The pattern is valid when the breakdown happens on rising volume.
- Risk: A false breakdown can cause losses if you enter before confirmation.
- Strategy: Target profit is measured from the flagpole length, with stop loss above the flag.
What is a bearish flag and why does it matter?
A bearish flag is a continuation pattern, not a reversal signal. It means the downtrend before the pattern will likely resume after a short pause. Traders use it to position for further downside, not to chase reversals. Before reading this pattern, get familiar with crypto types because liquidity affects how reliable the signal is.
In practice, this pattern is easier to find on assets that move with strong momentum, such as Bitcoin, Ethereum, or large-cap altcoins. The longer the flagpole, the wider the potential target after the breakdown.
How is a bearish flag formed?
A bearish flag forms in three main stages that you can observe on a chart.
1. Flagpole: Price falls quickly and deeply within a short period.
2. Flag: Price moves sideways or slightly upward inside a small channel.
3. Breakdown: Price breaks below the flag support and extends the downtrend.
Volume is the key at this stage. While the flag is forming, volume usually contracts, then it spikes during the breakdown. To apply this pattern in daily activity, first learn the basics of crypto trading tips.
Characteristics of a valid bearish flag
Not every flag-like pattern is tradable. You need to check several validity conditions. Active price watchers can use crypto day trading guides to strengthen confirmation.
• Clear flagpole: The initial decline should be at least 10-15% from the swing high.
• Flag is not too big: The consolidation usually stays below 50% of the flagpole length.
• Contracting volume: Trading activity drops while the flag forms.
• Neat structure: The flag support and resistance form a clean channel.
• Strong breakdown: Price closes below support, not just touches the line.
• Higher timeframe: The pattern is more reliable from the 1-hour timeframe and above.
After checking these conditions, also review overall market conditions with on-chain analysis. Data such as exchange inflows and transaction volume can confirm or cancel a bearish flag signal.
Bearish flag vs bullish flag
The bearish flag is often confused with the bullish flag because the shapes look similar. The main difference is the direction of the prior trend and the target after the breakout.
Example of a bearish flag in crypto markets
A classic example happened with Bitcoin in mid-2021. According to CoinGecko data, Bitcoin fell from around $58,000 in early May 2021 to $30,000 on July 19, 2021, a drop of about 48%. That downtrend did not move in one straight line; at several points, price formed a flag before the next breakdown.
According to Glassnode data as of March 2026, the BTC perpetual funding rate was around -0.01% per 8 hours. Negative funding means many traders are paying to hold short positions, so bearish pressure is still dominant. Combining negative funding with a bearish flag gives a stronger reason not to fight the trend.
If you want to observe this pattern directly, use Spot Trade to read real-time charts and watch volume behavior.
How to trade a bearish flag
Here are the steps you can follow when a bearish flag appears.
1. Identify the flagpole: Make sure there is a sharp decline before the consolidation.
2. Draw the flag support: Connect the lowest points inside the consolidation.
3. Wait for the breakdown: Do not enter until price closes below support.
4. Check volume: Enter when volume rises together with the breakdown.
5. Calculate the target: Measure the flagpole length and project it from the breakdown point.
6. Set a stop loss: Place it above the flag resistance to limit risk.
The ideal risk-reward for this setup is at least 1:
2. If the target is two times larger than the distance to your stop loss, the setup is more balanced. According to Thomas Bulkowski's backtest data published at ThePatternSite.com and accessed in March 2026, the average decline after a bearish flag breakdown ranges between 16-18%.
Main risks of trading a bearish flag
Every technical pattern can fail, and the bearish flag has several risks that often trap beginners.
• False breakdown: Price breaks support then reverses upward, hitting your stop loss. Wait for a close below support to reduce this risk.
• Low volume: A breakdown without strong volume often fails. Always compare breakdown volume with the flag volume.
• Wrong timeframe: Patterns on a 5-minute chart are noisier than those on the 1-hour or 4-hour chart. Use a larger timeframe to filter signals.
• Illiquid assets: Thin order books can cause large slippage when entering and exiting. Choose assets with high daily volume.
• 24/7 market: Crypto price gaps can still happen, especially during quiet sessions. Monitor active trading hours.
Checklist before entering a trade
Entry mistakes usually happen because the pattern is not fully formed. Before you act, learn how to place orders and use the platform through the Mobee Tutorial. Here is a checklist for a bearish flag setup.
• A clear flagpole has formed with at least a 10% decline.
• The flag is not too wide and moves against the downtrend.
• Volume contracts in the flag and starts rising near the breakdown.
• A clear support target exists below the breakdown level.
• The stop loss is set above the flag resistance.
• Risk-reward is at least 1:2 before execution.
Conclusion
The bearish flag is a continuation pattern that can help you read the potential for further downside, but it is not an instant signal. Pattern validity depends on the flagpole structure, volume behavior, and breakdown confirmation. You need to combine this pattern with risk management, timeframe selection, and market data. Never enter just because the chart looks like a flag without confirmation.
FAQ
Start with Mobee
Mobee is a digital asset platform licensed and supervised by OJK, helping users explore crypto and investment products with clearer access and practical learning. Start your investment journey through Mobee and choose products that match your goals and risk profile.