What Is FVG? Fair Value Gap Meaning and Chart Example
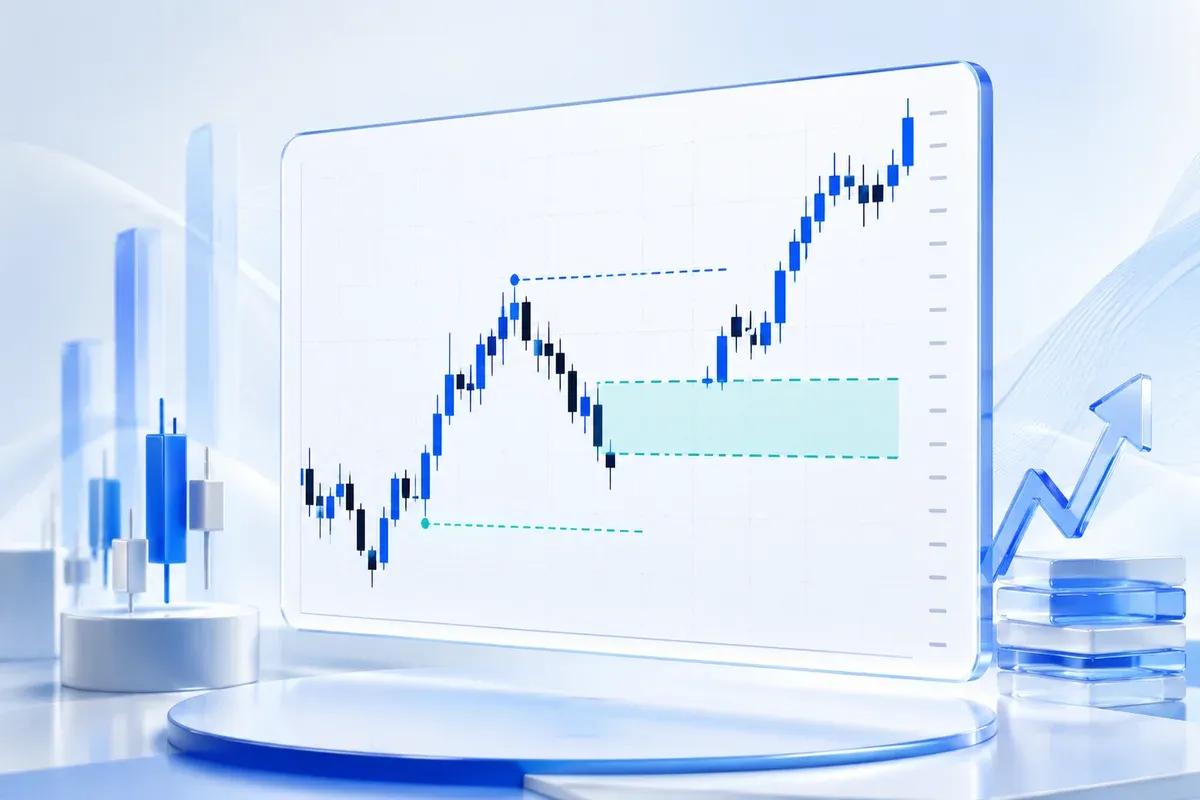
An FVG (Fair Value Gap) is a price gap on a candlestick chart that appears when one candle moves so fast that an area between the first and third candles is left untouched by price. Traders mark it as a zone price may revisit, though it does not always get filled.
The concept is popular with traders who use Smart Money Concepts (SMC). Understanding FVGs can help you read market momentum in a more structured way, especially in volatile crypto assets.
Key Points
- Definition: An FVG is a price gap caused by an order imbalance, often called an imbalance area.
- Function: It marks a zone price may revisit (a retest). There is no guarantee that price will return or reverse.
- Use: Commonly used on the H1, H4, and daily timeframes for entries and exits.
- Risk: Not every FVG gets filled; confirmation from other indicators is needed.
- Combination: More effective when combined with volume, support and resistance, or order blocks.
What Is a Fair Value Gap (FVG)?
An FVG is an area on a candlestick chart that price skipped because one candle moved too fast. In a bullish FVG, the area sits between the high of the first candle and the low of the third candle. In the Smart Money concept associated with Michael Huddleston (ICT), such an area is seen as a trace of large orders that were not fully filled. That is the interpretation of those who follow the concept, not a fact you can prove from the chart. Many traders pair FVGs with crypto trading tips to help pick entry areas.
How Does an FVG Work?
An FVG is formed by three consecutive candles. What matters is not the candle body but the tips of the wicks, the high and the low.
- Candle 1: the candle before the price surge. Note its high (for a bullish FVG).
- Candle 2: the impulse candle, a large candle that moves fast in one direction.
- Candle 3: the candle after the surge. Note its low.
A bullish FVG forms when the high of candle 1 is lower than the low of candle 3. The area between them is the FVG. A bearish FVG is the opposite: the low of candle 1 is higher than the high of candle 3.
Some traders wait for price to return to this zone before the trend continues, but price does not always return. An FVG is considered filled when a candle closes through the entire zone. On small timeframes gaps appear more often and fill quickly, while on large timeframes they are rarer but tend to last longer. For a deeper understanding, you can read on-chain analysis as a complement.
Why Do FVGs Happen?
An FVG happens when buy or sell orders arrive faster than the opposing orders, so price jumps across an area with few trades. It often shows up when big news breaks or when volume suddenly rises. According to Smart Money theory, such surges often come from large players, but that is an interpretation, not a fact you can confirm from a chart. Retail traders who spot the gap can use it as an area to watch. Still, not every FVG gets filled. The outcome depends on market structure, the trend on a larger timeframe, and liquidity at the time.
Benefits of Recognising FVGs in Trading
- Reference entry zone: An FVG gives a clear reference zone for entries, but risk is still there.
- Risk management: You can place a stop loss outside the FVG area.
- A level to watch: After it is filled, price sometimes reverses and sometimes breaks through.
- Suited to swing trading: Because FVGs work well on mid-range timeframes.
- Combines with indicators: An FVG is stronger when supported by volume or an order block.
Every benefit takes practice and hands-on chart reading. Learn about types of crypto with different FVG characteristics.
Risks of Relying on FVGs
- An FVG is not always filled: Price can keep moving without returning to the gap area.
- False signals: Especially in thin markets or during high-impact news.
- Overlapping FVGs: Many FVGs on one chart make it hard to decide which matters.
- Needs confirmation: An FVG alone is not enough; volume or momentum indicators are needed.
- Different timeframes: FVGs on small timeframes (M15) are less reliable.
To reduce risk, use the daily timeframe and make sure support and resistance levels confirm it. Read day trading crypto for more strategies.
An FVG on a BTC/USDT Chart, Step by Step
This example uses illustrative numbers so the math is easy to follow. It is not real market data and not an invitation to buy.
Imagine three consecutive bullish candles on a BTC/USDT chart:
| Candle | Open | High | Low | Close | Role |
|---|---|---|---|---|---|
| 1 | 59,200 | 60,000 | 59,000 | 59,900 | The candle before the surge. Its high is the lower edge of the FVG. |
| 2 | 59,900 | 61,500 | 59,850 | 61,400 | The impulse candle: large and moving fast upward. |
| 3 | 61,400 | 62,000 | 61,000 | 61,800 | The candle after the surge. Its low is the upper edge of the FVG. |
Step 1: mark the gap. The high of candle 1 is 60,000 and the low of candle 3 is 61,000. Because the high of candle 1 is lower than the low of candle 3, a bullish FVG forms in the area from 60,000 to 61,000. The gap is 1,000 wide, about 1.67% of the 60,000 price.
Step 2: check the context. Look at the direction of market structure on a larger timeframe. A bullish FVG is more worth watching when the larger trend is up rather than against it.
Step 3: set the plan before price arrives. One approach is to wait for price to drop back to the middle of the zone, then prepare a plan like this:
| Component | Level | Difference from entry |
|---|---|---|
| Limit entry | 60,500 (middle of the zone) | - |
| Stop loss | 59,800 (below the impulse candle's low) | risk 700 (1.16%) |
| Target | 62,600 | potential 2,100 (3.47%) |
| Risk-to-reward ratio | 1 : 3 |
A reward of 2,100 divided by a risk of 700 gives a ratio of 1 to 3. That means, if this scenario actually plays out, the result sought is three times the risk taken. A good ratio does not mean it will be reached: price may never return to the zone, or may hit the stop loss first. Details on placing it are in the stop loss guide.
Step 4: work out position size. Suppose your balance is 1,000 USDT and you only want to risk 1%, or 10 USDT. With a risk of 700 per BTC, the position size is about 10 / 700 = 0.01429 BTC, worth about 864.29 USDT at the entry price. If the stop loss is hit, the loss is roughly 10 USDT, before trading fees and slippage.
When is this FVG no longer valid?
- A candle closes below 60,000, meaning price has gone through the whole zone and the gap is considered filled. Consider cancelling the plan, even if the stop loss has not been hit.
- Price touches the stop loss at 59,800, meaning the scenario failed and the position is closed as planned.
- The trend on a larger timeframe turns down before price returns to the zone.
- Price never returns to the zone. In this case the limit order is not filled and you do not need to chase the price.
A bearish FVG is the mirror image: the low of candle 1 is higher than the high of candle 3, and the gap between them becomes a zone to watch above price.
If you want to wait for price to return to the zone without staring at the screen, you can place a limit order in Mobee's Spot Trade at the level you have decided. The order only fills when price touches that level, so you still need to set your risk limit before placing it.
FVG Summary Table
| Aspect | Description |
|---|---|
| Definition | A price gap formed by an order imbalance. |
| Timeframe | H1, H4, Daily |
| Supporting indicators | Volume, Order Block, and Support and Resistance. |
| Main risk | The Fair Value Gap is not filled or produces a false signal. |
| Suited to | Swing traders, SMC traders |
Strategy for Using FVGs
- Identify an FVG on the H4 or daily timeframe.
- Wait for price to return to the gap area.
- Enter on a confirmation candle (for example a pin bar or engulfing candle).
- Place a stop loss outside the FVG.
- Take profit at the nearest support or resistance level.
This strategy takes patience. Not every FVG needs to be traded. Learn about crypto staking as an alternative if you do not want to trade actively.
Conclusion
An FVG is a technical analysis tool that helps traders mark areas on the chart that price crossed quickly. Its strength is a clear reference zone, but there is no guarantee that price will return or reverse. Confirmation and risk management still matter. Learn the concept step by step and test it on a demo account before using real capital.
FAQ
What is an FVG in trading?
FVG stands for Fair Value Gap, a price gap in a three-candle pattern. In a bullish FVG, the high of the first candle is lower than the low of the third candle, and the area between them is a gap price did not touch. Traders use it as a zone to watch, not as a sure signal.
Which timeframe is an FVG valid on?
An FVG can appear on any timeframe, from minutes to daily. On small timeframes gaps appear more often and fill quickly, so they carry less weight. On large timeframes such as H1, H4, and daily, gaps are rarer but tend to last longer. For beginners, H4 and daily are usually easier to read.
Can FVG be used on stocks?
You can look for it on the candlestick chart of any asset, including stocks, as long as the data is liquid enough. The difference is that stocks have trading hours, so there are often opening gaps that differ from a three-candle FVG. Make sure you tell the two apart, and remember that this pattern does not guarantee price will return to the zone.
How do you tell a valid FVG from a false one?
There is no fixed standard, because an FVG is only a candle pattern. An FVG that deserves more attention usually forms after a clear impulse candle, is large relative to normal moves, goes with the trend on a larger timeframe, and sits near a support or resistance level. An FVG is considered no longer valid if a candle closes through the whole zone.
What is the difference between an FVG and an ordinary gap?
An ordinary gap is the difference between one candle's closing price and the next candle's opening price, common in stocks when the market opens. An FVG is read from three candles: the empty space between the high of the first candle and the low of the third, while the middle candle moves quickly through it. In crypto, which trades 24 hours, ordinary gaps are rare while FVGs are common.
Disclaimer
This article is for information and education only, not an invitation or recommendation to buy or sell any asset. The example above is an illustration. Crypto assets are high risk and their value can fall sharply. Do your own research and only use funds you can afford to put at risk. Mobee is operated by PT CTXG Indonesia Berkarya, licensed and supervised by OJK.
Mobee is a digital asset platform licensed and supervised by OJK, so you can follow market opportunities and investment products in a more structured way. Start your investing journey with Mobee and choose products that fit your goals and risk profile.
 Direct market access from the app
Start exploring digital assets with Mobee
Track the market, learn about digital assets, and start trading more conveniently with the Mobee App.
Mobee is licensed and supervised by the OJK. Not a solicitation to buy or sell any asset.