TradingView: Track the Entire Market in One Platform
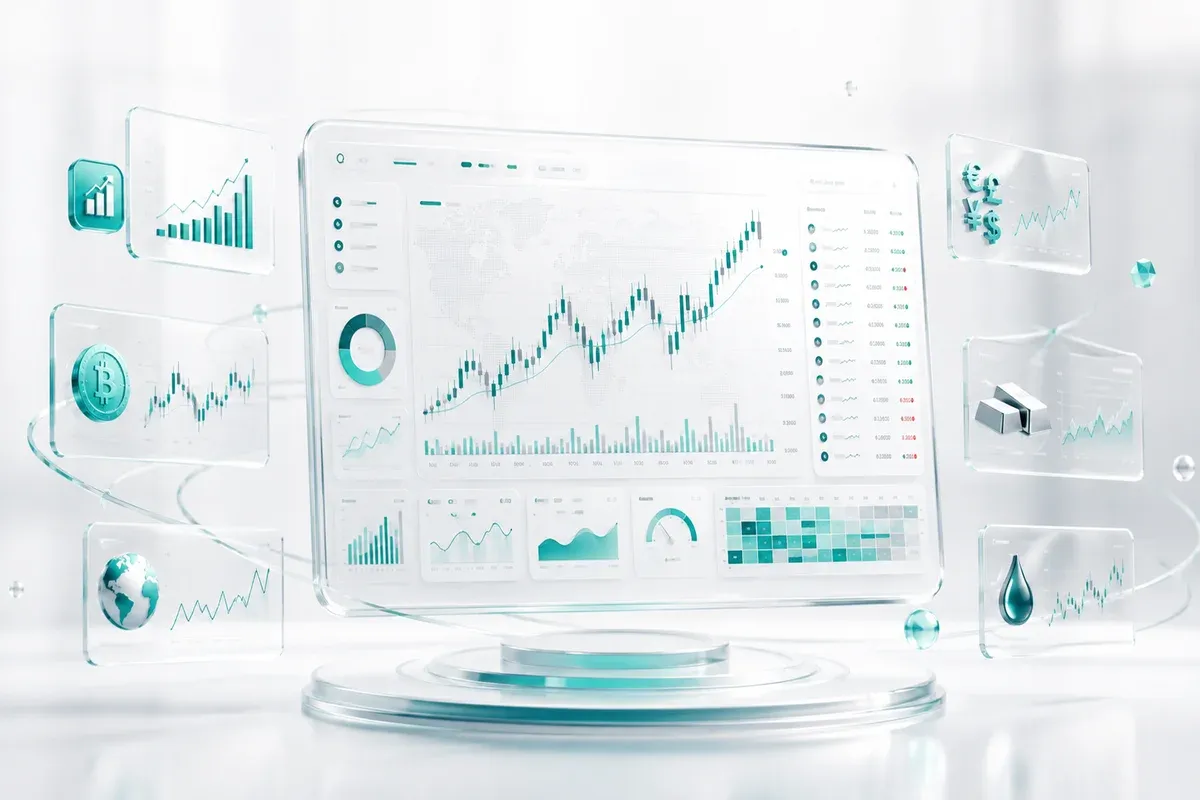
TradingView is a charting platform and social network built to track the entire market in one dashboard, covering crypto, US stocks, forex, commodities, and global indices. You can follow real-time prices, apply technical indicators, and build watchlists for thousands of assets without switching apps. This guide covers how TradingView works, its main features, and the limits you need to know before relying on it. Start by reading these trading crypto tips from Mobee Academy.
Key Points
-
Multi-asset platform: TradingView connects multiple exchanges and financial instruments in one interface for daily analysis.
-
Technical analysis focus: Its core value is interactive charts, indicators, screeners, and price alerts.
-
Free plan limits: Advanced tools like multi-chart layouts require a paid subscription, so choose based on your needs.
-
Not a broker: TradingView helps with research, not with placing actual buy or sell orders.
-
Use it with an exchange: You still need a licensed trading platform to execute your strategy.
What is TradingView and why has it become popular?
TradingView is a web and mobile charting platform founded in 2011. According to TradingView's official About page as of March 2026, the platform has more than 60 million traders and investors. Its popularity comes from combining market data, technical analysis tools, and social features in one place.
New users can open a chart instantly and see trade ideas shared by the community. This makes the platform a natural starting point for people who want to monitor multiple markets without installing heavy software. If you are new to digital assets, understanding crypto types helps you decide which instruments to watch first.
How TradingView tracks the entire market
TradingView pulls data from multiple brokers, data providers, and exchanges, then displays it as customizable charts. Every asset has a ticker, such as BTCUSDT for Bitcoin, AAPL for Apple, and XAUUSD for gold. The data updates in real time, but the speed can vary by account type and data source.
1. Choose an asset: Type the asset name into the search bar and pick the matching ticker.
2. Set the timeframe: Select intervals from 1 minute to 1 month.
3. Add indicators: Apply RSI, MACD, EMA, or other tools to clarify signals.
4. Build a watchlist: Save the assets you want to monitor every day.
5. Create alerts: Receive notifications when price breaks your key level.
6. Execute outside TradingView: Once the analysis is ready, place trades on an exchange.
TradingView can be combined with on-chain analysis to check wallet movements and fund flows behind the price. Using both methods gives a fuller picture than charts alone.
Markets and assets you can track
One of the main advantages of TradingView is its wide market coverage. You can track crypto, stocks, forex, commodities, and indices from a single account. According to TradingView's official feature page as of March 2026, the platform connects to more than 100 exchanges.
• Crypto: BTC, ETH, SOL, and thousands of coin pairs from major exchanges.
• US stocks: Apple, Tesla, Nvidia, and major indices like the S&P 500.
• Forex: Major pairs such as EURUSD, USDJPY, and GBPUSD.
• Commodities: Gold, silver, crude oil, and natural gas.
• Global indices: FTSE, DAX, Nikkei, and other regional benchmarks.
This broad coverage helps you see asset rotation. For example, if Bitcoin falls while gold rises, you can study how capital is moving without opening separate apps.
Key features worth trying
TradingView is more than a simple chart. These features are the main reason traders choose it. According to TradingView's Pine Script documentation as of March 2026, the community has shared more than 100,000 public scripts.
• Interactive chart: Useful for drawing support, resistance, trendlines, and price patterns.
• Indicator library: Dozens of built-in indicators and thousands of community scripts.
• Multi-chart layout: Compare multiple assets on one screen.
• Market screener: Filter assets by price, volume, market cap, and technical signals.
• Price alerts: Automatic notifications when a target level is reached.
• Pine Script: A scripting language for custom indicators and strategies.
After spotting a possible entry, compare prices across exchanges. In Indonesia, you can use Spot Trade on Mobee to execute the trade after your research.
Beginner's guide to starting with TradingView
Start with simple steps. You do not need to master every feature on day one.
1. Create a free account: Register with an email or Google account on TradingView.
2. Open one chart: Choose BTCUSDT or a stock you already know.
3. Explore the toolbar: Familiarize yourself with timeframe, indicator, drawing, and watchlist menus.
4. Start with 1-hour or 1-day intervals: These timeframes help you see the bigger trend.
5. Add just one indicator: EMA 20 and RSI are good for reading direction and momentum.
6. Set a price alert: Use support or resistance levels to practice tracking market moves.
Avoid adding too many indicators too soon. Focus on understanding price action and key levels before building a full strategy.
Why TradingView is useful for crypto analysis
Crypto investors use TradingView as a bridge between technical data and execution. The same charting system works for Bitcoin, Ethereum, and new altcoins.
• Real-time crypto data: Prices from major exchanges are available without long delays.
• Familiar interface: You can analyze crypto with the same tools used for stocks.
• Active community: Many traders share ideas on specific coins and tokens.
• Crypto screener: Helps identify assets with strong volume or momentum.
• Flexible alerts: Useful for short-term trading and long-term investing.
Because technical signals are not perfect, you should also check factors outside the chart. Read day trading crypto strategies to understand position management in fast-moving markets.
Limitations and risks to understand
TradingView is powerful but has limitations. Knowing them prevents false confidence.
• Delayed data: Free accounts can see delayed prices for stocks or indices.
• Paid feature wall: Multi-chart and extra alerts are locked behind a subscription.
• Not every exchange appears: Coins from smaller exchanges may be missing.
• Indicators are not guarantees: Price can move against a signal at any time.
• Not an execution venue: TradingView does not replace an exchange for buying or selling.
The biggest risk is treating indicators as certainties. Use TradingView as a research tool, then confirm with news, volume, and proper risk management. For a practical walkthrough, check the Mobee tutorials page.
Free vs paid plans comparison
Based on TradingView's pricing page as of March 2026, paid plans start at around $12.95 per month when billed annually. Your plan affects how many indicators, layouts, and alerts you can use.
| Feature | Free Plan | Paid Plans |
|---|---|---|
| Price | $0 | Starts around $12.95 per month billed annually as of March 2026 |
| Indicators per chart | Limited | More, and up to unlimited on Premium |
| Chart layouts | Limited layout | Multi-chart layouts available |
| Price alerts | Limited | More alerts and personalization options |
| Market data | Depends on exchange | More complete real-time data for many symbols |
| Best for | Beginners and light research | Active traders and technical analysts |
New traders can start with the free plan and learn the basics. Upgrade only when you need multi-chart layouts, more indicators, or additional alerts.
Strategy for daily market research
Consistency matters more than using every tool at once. A simple routine keeps your market reading structured.
1. Set a watchlist: Pick 5-10 assets that match your strategy and risk tolerance.
2. Analyze multiple timeframes: Use the daily chart for trend and a smaller timeframe for timing.
3. Draw key levels: Mark support and resistance zones on your chart.
4. Use alerts wisely: Set notifications at important levels so you do not watch the screen all day.
5. Review fundamentals and sentiment: Read news and on-chain data to confirm the technical signal.
6. Evaluate weekly: Compare your analysis notes with actual market moves.
This routine builds experience faster than randomly changing charts and timeframes.
Conclusion
TradingView is an excellent tool for tracking the entire market, from crypto to global stocks. Beginners should start with the free plan, keep a small watchlist, and learn one indicator at a time. Remember that TradingView supports research, while execution still takes place on a licensed exchange.
FAQ
Is TradingView free, and what limits does the free plan have?
Yes, TradingView offers a free plan. The limits include fewer indicators per chart, fewer alerts, and limited chart layouts. Based on TradingView's pricing page as of March 2026, paid plans start at around $12.95 per month billed annually, so the free plan is still useful for learning basics.
Can I trade crypto directly on TradingView?
Usually not. TradingView is a charting platform, not an exchange. Some brokers can be connected in certain countries, but for buying and selling crypto, you need a licensed exchange. Use TradingView for analysis, then execute on your exchange.
What is the difference between TradingView and MetaTrader?
TradingView focuses on web access, community ideas, and market screening, while MetaTrader is often used for forex trading and automated execution. Beginners often find TradingView easier to use because of its modern interface and support for crypto and stocks.
How do I start learning TradingView as a beginner?
Create a free account, open a chart, and add one indicator such as EMA 20 or RSI. Build a small watchlist, set a price alert, and practice drawing support and resistance. Learn one concept at a time before exploring Pine Script or advanced screeners.
Is TradingView data real-time?
Most crypto data is real-time, but stock and index data may be delayed depending on your plan and data source. On the free plan, some US stock data can show a delay. Check the data status indicator in the upper-left corner of your chart to confirm.
Start with Mobee
Mobee is a digital asset platform licensed and supervised by OJK, helping users explore crypto and investment products with clearer access and practical learning. Start your investment journey through Mobee and choose products that match your goals and risk profile.
 Direct market access from the app
 Start exploring digital assets with Mobee
Track the market, learn about digital assets, and start trading more conveniently with the Mobee App.
Mobee is licensed and supervised by the OJK. Not a solicitation to buy or sell any asset.