
A Doji candle is a candlestick pattern formed when an asset’s opening and closing prices are at nearly the same level. This condition creates a very small candle body, while the upper and lower wicks may be short or long, depending on price movement. The pattern represents a market without a clear direction, as buying and selling pressure are in balance.
In trading, a Doji is considered an important signal because it indicates that the ongoing trend may be losing momentum. When the market shows uncertainty, the potential for price reversal or momentum shift often increases. However, a Doji is also neutral in nature, so it must be interpreted together with the broader market context.
Read also: Understanding the Shooting Star Candle and Effective Trading Strategies
Why Doji Candles Matter in Technical Analysis?
Traders often use candlestick patterns to gauge market sentiment. Doji patterns play a major role because:
1. Indicates Market Indecision
When a Doji appears, it means market participants lack strong conviction to push prices in a clear direction. This often serves as an early warning that the previous trend may be weakening.
2. Signals Potential Reversal
A Doji that appears after a long uptrend may indicate that buyers are losing strength. Conversely, a Doji at the bottom of a downtrend may signal weakening selling pressure.
3. Confirms Trend Continuation
Although commonly associated with reversals, a Doji can also signal consolidation before the trend continues. Therefore, its position on the chart greatly influences its interpretation.
Types of Doji Candles
Doji candles come in several variations, each offering different insights into market psychology. The most common types include:
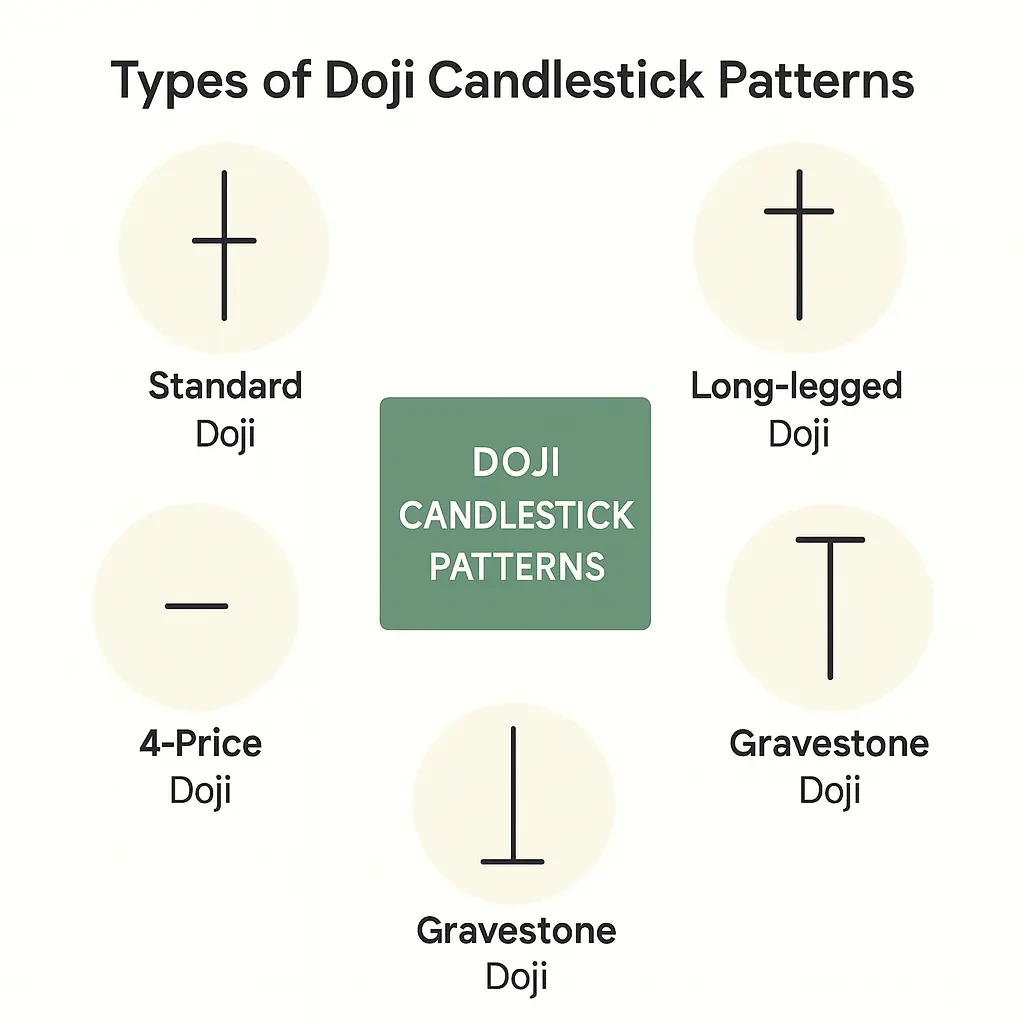
1. Standard Doji
A very small body with relatively balanced upper and lower wicks. This pattern shows that the market truly lacks direction, prompting traders to wait for confirmation from the next candle.
2. Long-Legged Doji
Features long wicks on both sides, signalling high volatility. Prices move aggressively up and down but ultimately return near the opening level. This pattern reflects deeper market indecision.
3. Dragonfly Doji
Has a long lower wick with the body near the top, resembling the letter “T”. It often appears when the market rejects lower prices and is considered a potential bullish signal when found in a downtrend.
4. Gravestone Doji
The opposite of a Dragonfly Doji. It has a long upper wick with no lower wick, showing rejection of higher prices. It often signals a potential bearish reversal, especially at the top of an uptrend.
5. Four-Price Doji
A rare pattern where the open, close, high, and low prices are all the same. It appears as a short horizontal line and usually occurs in extremely quiet markets with low trading activity.
How to Correctly Read Doji Candles
To make Doji patterns more accurate as signals, traders should consider the following:
1. Observe the Previous Trend
A Doji that appears after a strong trend carries more meaning. After an uptrend, it may signal a potential downward reversal; after a downtrend, it may hint at an upcoming rebound.
2. Watch Key Support and Resistance Levels
A Doji near an important price level provides a stronger signal. For example, a Doji near resistance may increase the likelihood of a decline.
3. Use Supporting Indicators
Indicators like RSI, MACD, or Moving Averages can help confirm whether the market is losing momentum. Declining volume is also a common confirmation that a Doji indicates a shift in sentiment.
4. Wait for Confirmation Candles
A Doji is not a standalone signal. The next candle plays an important role in determining market direction. For instance, if a bullish engulfing candle appears after a Doji at the bottom of a downtrend, the potential for a bullish reversal becomes stronger.
Read also: Resistance Is the Ceiling of Crypto Prices Explained
Strategies for Using Doji in Trading
Here are common strategies that utilize Doji patterns:
- Reversal Trading: Look for Doji patterns after strong trends, then wait for confirmation before taking a position.
- Breakout Anticipation: A Doji in a consolidation phase may indicate that the market is gathering momentum. Traders can prepare for potential breakouts.
- Improved Risk Management: Because Doji signals uncertainty, traders can use it to tighten stop losses or secure profits.
Conclusion
A Doji candle is an essential pattern in technical analysis that reflects market confusion and imbalance. Although neutral, a Doji becomes a strong signal when combined with trend context, key price levels, and technical indicators. By understanding types such as Standard, Long-Legged, Dragonfly, Gravestone, and Four-Price Doji, traders can enhance the accuracy of their analysis and decision-making.
Start exploring digital assets more easily. Download the Mobee app and begin your investment journey today!