Understanding the Shooting Star Candle and Effective Trading Strategies

The shooting star candle is one of the candlestick formations often used by traders in technical analysis. It appears after an uptrend and can serve as a warning that bullish momentum is weakening. Visually, the pattern is marked by a small candle body at the lower end, a long upper shadow (at least twice the length of the body), and a very small or absent lower shadow.
Read more: 5 Popular Indicators Every Crypto Trader Should Know
Key Characteristics of a Shooting Star Candle
- A small candle body at the bottom indicates that the opening and closing prices occurred within a narrow range.
- Long upper shadow—at least twice the body’s size—showing strong selling pressure against buyers.
- Very short or absent lower shadow, indicating that the price failed to sustain its high levels.
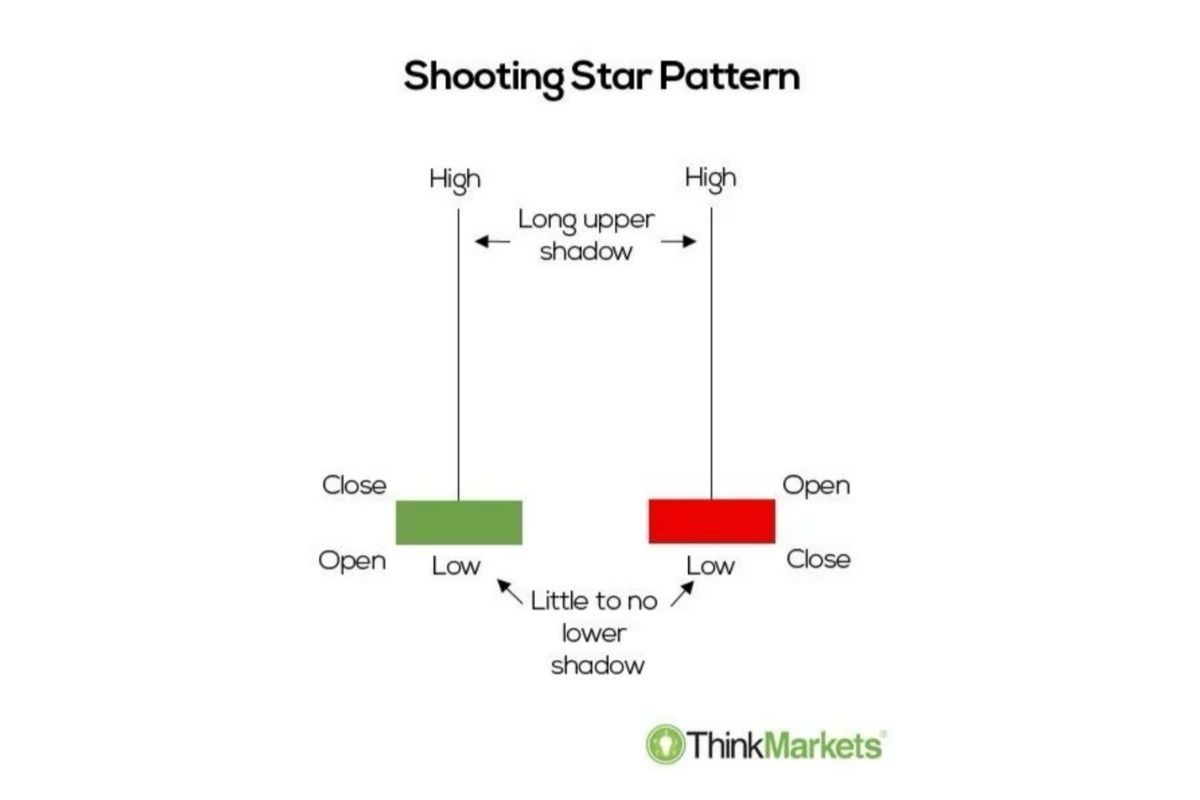
Source: ThinkMarkets
Meaning & Context of the Pattern
The shooting star candle generally forms after a prolonged uptrend. Its appearance signals that upward momentum is starting to lose steam. Initially, buyers push the price to new highs, but sellers quickly step in and drive it back down near the opening price.
This reflects a shift in dominance from buyers to sellers. While optimism exists early in the session, the market closes on a pessimistic note. For this reason, a shooting star is often regarded as an early indication of a potential bearish reversal.
However, traders are advised not to rely solely on this single candle. Confirmation from subsequent bearish candles or supporting technical indicators like RSI, MACD, or trading volume is needed to validate the signal.
Color Differences: Green vs. Red
In general, the color of the shooting star's body—whether green (bullish) or red (bearish)—doesn’t significantly change its meaning. Both indicate a weakening uptrend.
- Green shooting star: Closing price is slightly higher than the opening, but the long upper shadow still signals strong selling pressure.
- Red shooting star: Closing price is lower than the opening, signaling stronger selling pressure. This is why red shooting stars are often considered a more reliable bearish signal.
Understanding this context helps traders judge whether the pattern is merely a “warning” or a true sign of trend reversal.
Confirmation for Validity
One shooting star candle alone is not sufficient for decision-making. Traders should wait for:
- A bearish follow-up candle, such as a significant drop closing below the shooting star body.
- Additional technical confirmations, like RSI (overbought), MACD crossovers, or high trading volume when the pattern appears.
Practical Trading Strategies
- For long positions: Consider taking profit or securing gains.
- For short traders: This can be a potential entry signal, especially if confirmed by a subsequent bearish candle.
- Always apply risk management with stop-loss orders placed just above the shooting star’s high.

Strengths & Limitations
Like any candlestick pattern, the shooting star has its advantages and limitations.
Strengths:
- Easy to recognize visually with its distinctive small body and long upper shadow.
- Effective in detecting potential reversals when occurring at the peak of an uptrend.
Limitations:
- Prone to false signals if not confirmed by other candles or indicators.
- Less reliable in low-volume markets or when momentum is weak.
In other words, while the shooting star is clear and easy to identify, smart traders should never rely on it alone. Wise trading decisions must involve confirmation, supporting indicators, and disciplined risk management.
Read more: What Can You Do with the Mobee API?
Differentiating Shooting Star from Similar Patterns
New traders often confuse the shooting star with other patterns:
- Inverted Hammer: Visually similar to a small body and long upper shadow, but it appears at the end of a downtrend and signals potential bullish reversal—the opposite psychology of a shooting star.
- Evening Star: A three-candle pattern forming after an uptrend, considered a stronger bearish reversal signal. A shooting star may be part of an evening star, but confirmation is clearer when multiple candles are involved.
Recognizing these differences prevents misinterpretation. A shooting star is only valid when it appears after a significant uptrend. If found during a downtrend, it is likely an inverted hammer instead.
Conclusion
The shooting star candle is a valuable technical signal for spotting potential bearish reversals. However, it should be treated only as an indication—confirmation and proper risk management are essential.
You’ve learned the theory, now it’s time to practice. Download Mobee, the trusted trading app, and take your first step in smarter trading today!
Disclaimer:
This content is intended to provide additional information to readers. Always conduct your own research before making any investment. All crypto trading and investment activities are entirely the responsibility of the reader.
 Direct market access from the app
Start exploring digital assets with Mobee
Track the market, learn about digital assets, and start trading more conveniently with the Mobee App.
Mobee is licensed and supervised by the OJK. Not a solicitation to buy or sell any asset.