
The U.S. M2 money supply has swelled to an unprecedented $22.12 trillion, a development that extends far beyond the world of traditional finance. This surge in liquidity reflects a system awash with cash and deposits, and its ripple effects are likely to be felt across asset classes. For the crypto market, in particular, the expansion of M2 represents both an opportunity and a challenge. As history has shown, periods of abundant liquidity often coincide with a resurgence in risk assets, and digital currencies like Bitcoin and Ethereum are no exception.
The immediate impact of M2 growth lies in its effect on liquidity and investor sentiment. With more money circulating through the economy, risk appetite tends to increase, driving capital flows toward higher-yielding or alternative investments. In this environment, Bitcoin and Ethereum stand out as natural beneficiaries. Both have demonstrated strong historical correlations with expansions in money supply, with investors often turning to crypto as a hedge against fiat currency debasement and as a vehicle to capture upside in times of excess liquidity.
Yet, abundant liquidity does not eliminate hurdles, especially for emerging Web3 startups and decentralized finance platforms. The integration of fiat into crypto ecosystems is often accompanied by compliance challenges, API risks, and regulatory uncertainties. While larger institutions may have the resources to navigate these complexities, smaller players are more exposed to friction, potentially limiting their ability to capture the benefits of an M2-driven liquidity surge.
Ultimately, the U.S. M2 surge signals a pivotal moment for crypto. The unprecedented liquidity backdrop offers a unique window for Bitcoin, Ethereum, and the broader digital asset ecosystem to accelerate adoption and deliver strong returns. At the same time, the challenges of regulation, compliance, and systemic risk remain very real. For investors and innovators alike, the path forward will require not only optimism but vigilance. Understanding the interplay between money supply and crypto markets may prove to be the key to navigating this new era of liquidity.
BTC Technical Analysis
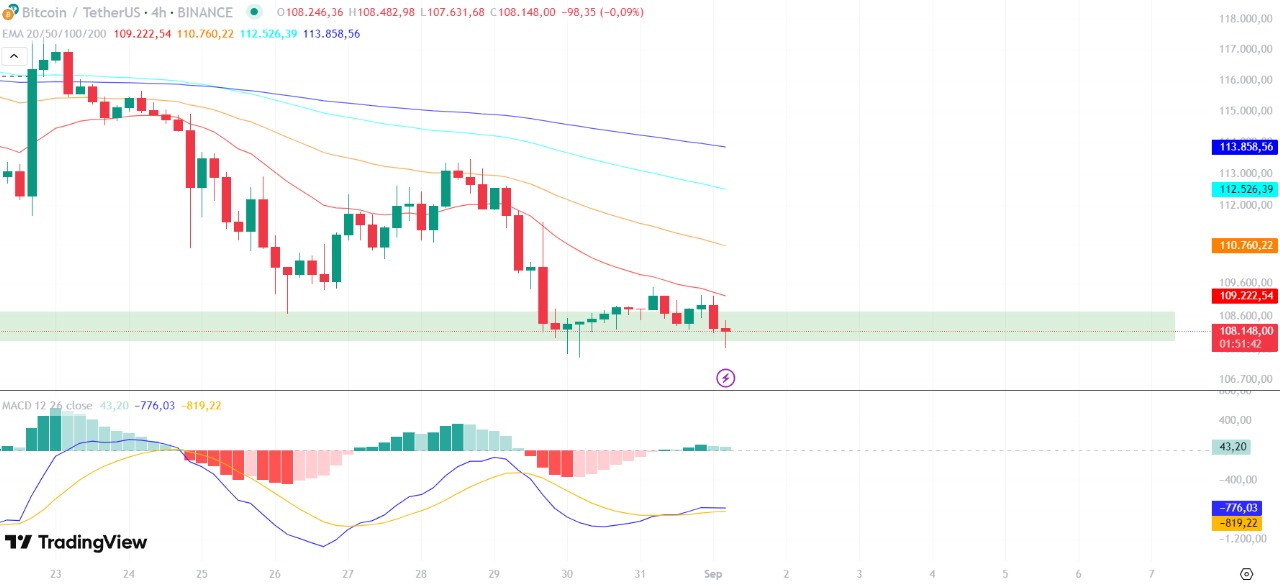
BTC has broken below the $109,222 support level and is now trading around $108,074, confirming a lower-high, lower-low (bearish) structure. Price sits below all major EMAs (20/50/100/200), reinforcing a bearish bias. The MACD shows the MACD line at bearish with a possible reversal.
- Structure: Bearish (LH/LL)
- EMA: Below all EMAs → momentum weak
- MACD: Bearish trend, but momentum weakening
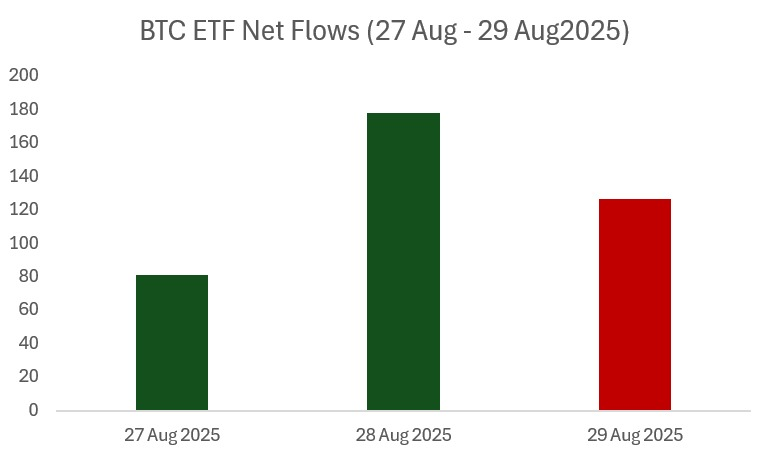
Between August 27 and August 29, 2025, Bitcoin ETFs recorded net flows of $81.4 million, $178.9 million, and –$126.7 million. The back-to-back inflows highlight renewed investor confidence, though the sharp reversal on the final day signals lingering volatility in sentiment.
Overall, the trend suggests that while interest in BTC is recovering, stability remains uncertain. Sustained inflows will be essential to strengthen price momentum and confirm a broader bullish reversal.
ETH Technical Analysis
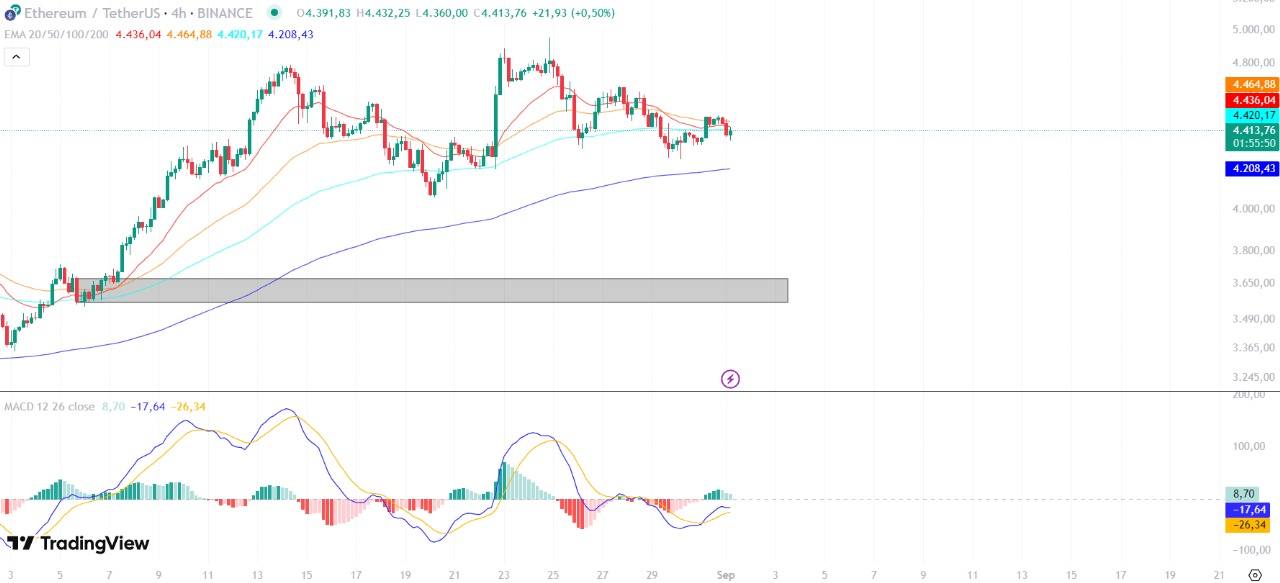
ETH has recently approached the $4,436 resistance level and is trading just below it. The price is below the 20 and 50 EMAs but above the 100 and 200 EMAs, indicating a mixed momentum with potential support. The MACD shows a bearish crossover with decreasing momentum, suggesting caution.
- Structure: Neutral (testing support)
- EMA: Below 20/50, above 100/200 → mixed momentum
- MACD: Bearish crossover, momentum weakening
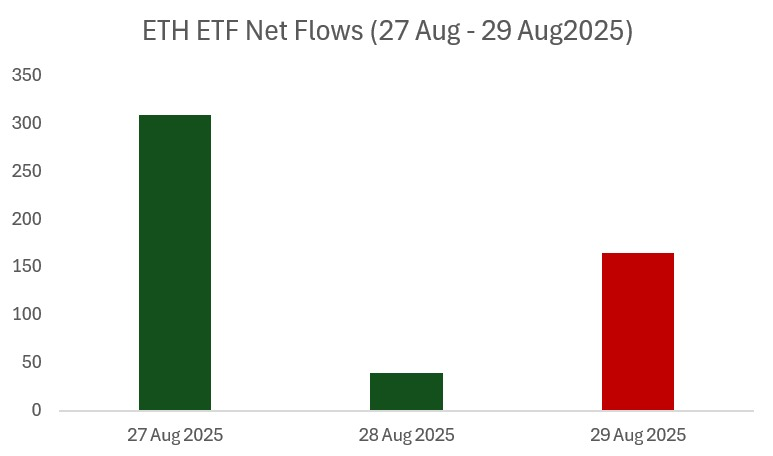
Between August 27 and August 29, 2025, Ethereum ETFs posted net flows of $309.5 million, $39.1 million, and –$164.6 million. The strong initial inflow underscores solid demand, but the sharp swing into outflows by the end of the period reflects how quickly sentiment can shift.
Overall, the pattern shows investor appetite for ETH remains uneven. A steadier stream of inflows will be critical to reinforcing price resilience and building confidence in Ethereum’s medium-term outlook.
SOL Technical Analysis
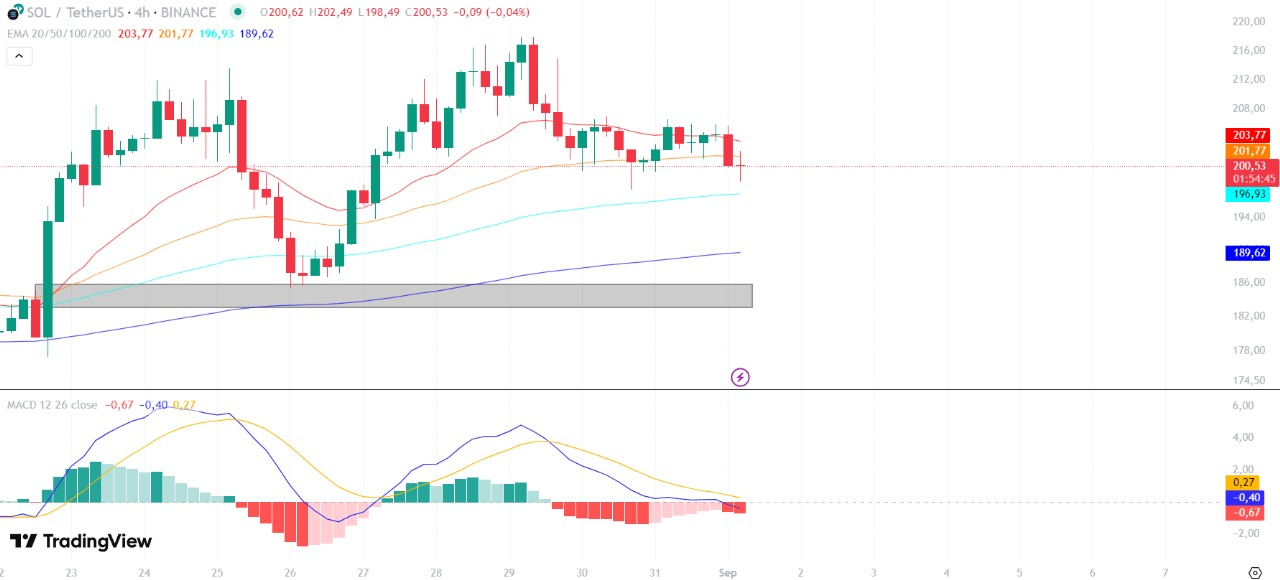
SOL is trading near the $189.62 support level, with price action showing a consolidation phase. The price is below the 20 EMA but above the 50, 100, and 200 EMAs, suggesting a weakening but not fully bearish trend. The MACD indicates a bearish divergence with declining momentum.
- Structure: Neutral (consolidation near support)
- EMA: Below 20, above 50/100/200 → weakening momentum
- MACD: Bearish divergence, momentum declining

The latest data shows that DEX trading volume remains elevated in 2025 compared to prior years, but has eased off from the sharp spikes seen earlier this year. While activity remains well above 2023 levels, the recent moderation signals a cooldown in trading momentum, suggesting that participants are becoming more selective in deploying liquidity within the decentralized ecosystem.