
If you’ve looked at your portfolio recently, the excitement of late 2025 may feel like a distant memory. With Bitcoin trading around $67,000 (down from its $125,000 peak), it is natural to question the market’s next move.
However, these moments are known as "The Great Filter." It is a period where short-term speculation is washed out, and the market structure is tested and strengthened before the next major growth cycle begins.
Read more: Bullish and Bearish Explained in Crypto Investment
Context Matters: Comparing Bear Markets
To understand 2026, we must look at how it differs from previous downturns.
1. 2018: The "Utility" Filter
The post-2017 crash was about clearing out projects that had no real product. It was a painful but necessary "cleanup" that paved the way for the birth of DeFi.
2. 2022: The "Trust" Filter
The 2022 crash was a crisis of confidence triggered by the failure of centralized players (FTX, Celsius). This forced the industry to adopt higher standards of transparency and regulation.
3. 2026: The "Macro" Filter
Today’s dip is different. There are no major protocol failures or scandals. Instead, we are seeing the effects of global macroeconomic pressure (high interest rates and tight liquidity). The technology is working perfectly, and institutions are still participating via ETFs. This is a "cyclical adjustment," not a fundamental breakdown.
Data Over Emotions: Key Indicators
Successful investors use data to cut through the noise. Here is what the numbers are telling us right now:
- MVRV Z-Score: This "valuation thermometer" shows that after the "overheated" market of 2025, Bitcoin has returned to a fair value zone. It’s no longer "expensive" by historical standards.
- Investor Behavior (SOPR): Data shows short-term holders are currently selling at a loss. Historically, when the "weak hands" exit the market, we begin to see a price floor forming.
- Institutional Floor: Large-scale institutional entry points are estimated between $55,000 and $60,000. This serves as a significant psychological and technical support level.
Strategies for Navigating Volatility
The hardest part of a correction isn't the price, it's the emotional toll of trying to "time the bottom." This is why professional traders rely on Dollar Cost Averaging (DCA).
By breaking your investment into smaller, scheduled amounts (e.g., Rp1 million per week), you:
- Lower your average entry price during dips.
- Remove emotional bias from your decision-making.
- Maintain consistency regardless of short-term volatility.
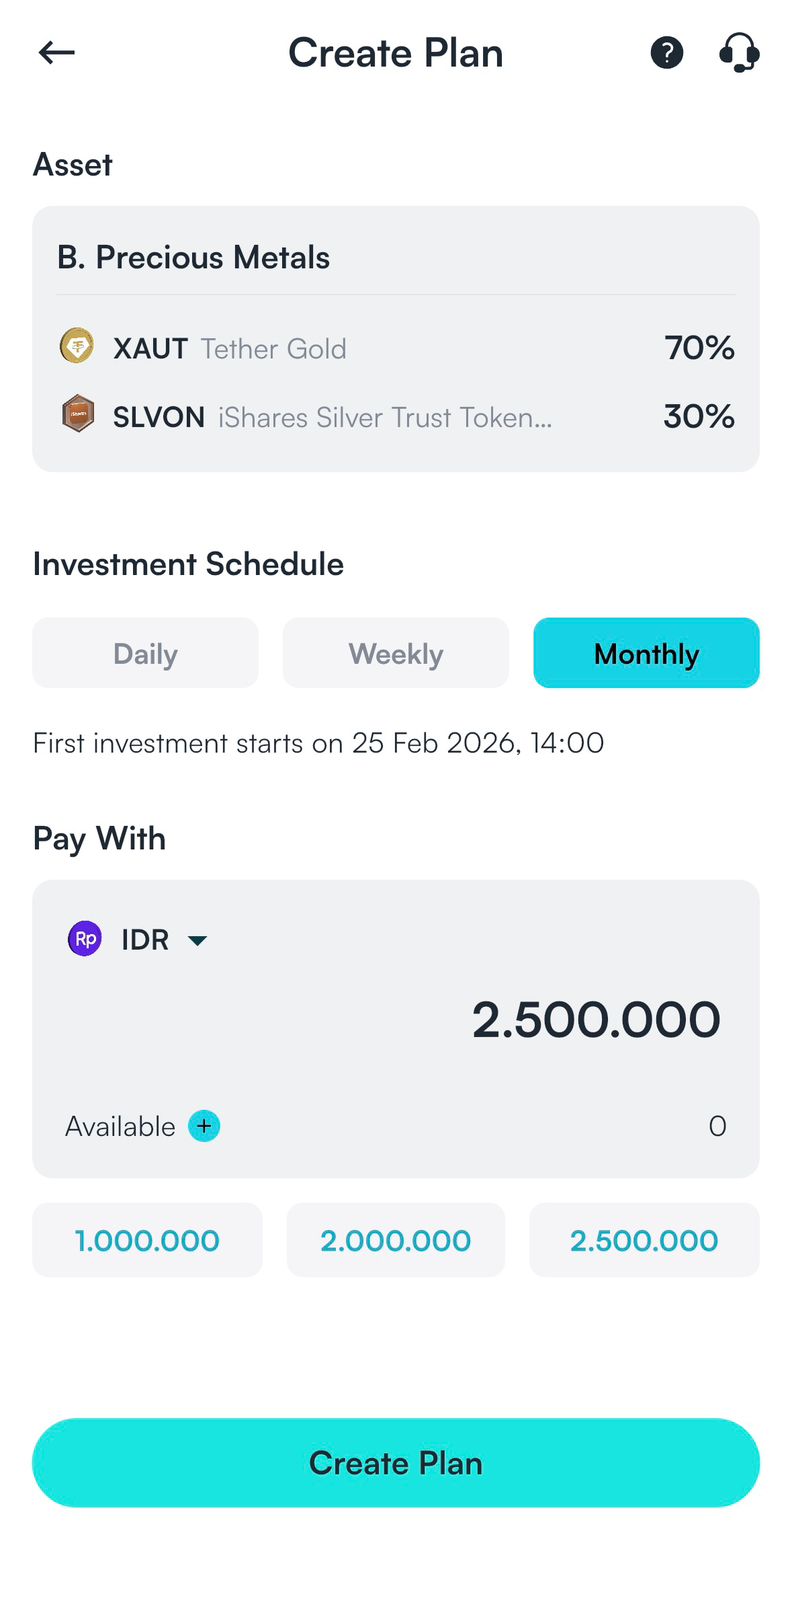
You don't need to stare at charts all day to be a disciplined investor. Mobee’s Auto Invest feature automates your DCA strategy. You can set your frequency (daily, weekly, or monthly) and let the system execute for you.
With the Multiple Coins option, you can build a diversified "Safety Bundle" of Blue Chips and Safe Haven assets in one go. You can monitor your progress in real-time, ensuring your long-term goals stay on track while the market settles.
The Bottom Line
Corrections are a natural part of the cycle for risk assets, including crypto. Such phases are usually periods of adjustment for both price and market expectations. In the long run, the industry's direction will continue to be heavily influenced by regulatory developments, the level of institutional adoption, and advancements in infrastructure and real utility. These factors tend to be more decisive than short-term price movements.
Ultimately, investment strategies should be tailored to individual risk profiles, financial goals, and time horizons. As a technical reference, several levels currently being watched by market participants include:
- $58k–$69k: Consolidation/accumulation zone.
- Below $52k: Increased risk area.
- Above $73k: Indication of trend recovery.
These levels are indicative, subject to change following market dynamics, and do not constitute investment advice.