Trading Indicators: Types, Functions, and Risks
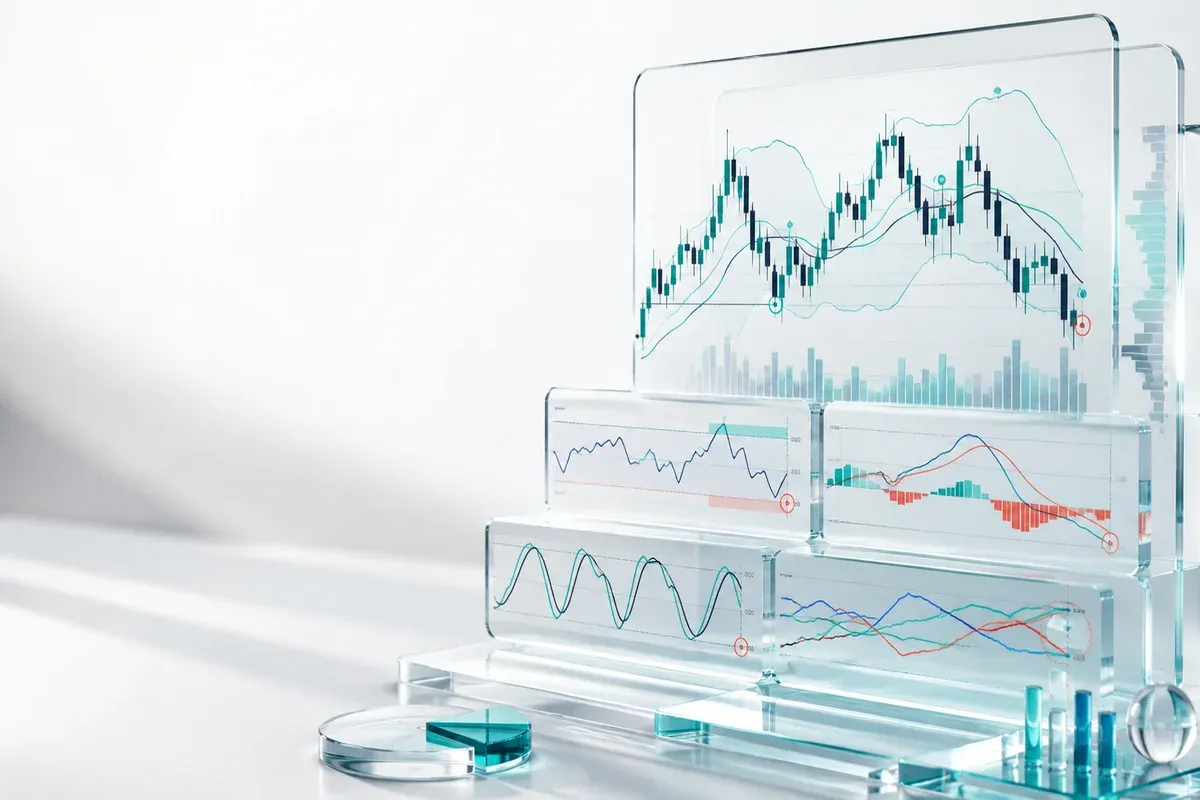
Trading indicators are statistical tools that turn historical price and volume data into visual signals for identifying trends, momentum, and possible reversal zones. They are not crystal balls, but they give traders a structured way to interpret market movement instead of relying on emotions.
Indicators work best when combined with market structure analysis, position sizing, and a clear exit plan. Before you build your strategy, study how each tool works and what limits it has through these crypto trading tips.
Key Points
-
Signal tool: Trading indicators turn raw price data into readable signals, but they never guarantee a certain outcome.
-
Two categories: Leading indicators give early warnings, while lagging indicators confirm the trend that is already running.
-
Popular choices: RSI, MACD, and Bollinger Bands are available on almost every modern trading platform.
-
False signal risk: Indicators can fail in sideways markets or low volume, so you need confirmation.
-
Success factor: Combine indicators with a trading plan, stop-loss, and volume analysis before opening a position.
Indicator Combination Example for Beginners
A simple setup is moving average 50 and RSI 14 on a 1-hour chart. This example gives beginners a clear order of analysis without piling up too many tools.
1. Confirm the trend: Make sure price stays above the 50-period moving average in a bullish setup.
2. Watch for a pullback: Wait for price to move closer to the moving average without breaking it.
3. Check RSI: Enter when RSI sits in the 50-60 zone or begins turning up from the 40 level.
4. Set the stop-loss: Place it below the latest swing low or below the pullback area.
5. Take profit gradually: Close part of the position when price reaches the nearest resistance area.
This framework will not guarantee profits, but it gives you a clear process to review. If you are new, study practical order setup through the Mobee tutorials.
Risks and Limitations of Indicators
Every indicator relies on historical data, so it can fail in fast-changing market conditions. Knowing its limitations should be part of your strategy.
• False signals in sideways markets: Momentum indicators can fire conflicting buy and sell signals. Filter them using trend direction and volume.
• Lagging indicators arrive late: Moving average reacts only after price has already moved. Do not chase the entry; wait for a pullback.
• Parameters are not universal: RSI 14 may not be optimal for every asset or timeframe. Backtest a range of periods before committing.
• Too many indicators create confusion: More tools often produce more conflicting signals. Limit yourself to two or three indicators with different roles.
• Market conditions change: A strategy that works in a bull market can break in a bear market. Adjust your setup to the current phase.
These risks can be reduced with clear entry and exit rules and proper position sizing. Indicators are never a replacement for risk management.
Quick Comparison Table
The table below summarizes the basic functions and limitations of the five most common indicators.
| Indicator | Primary Function | Category | Main Limitation |
|---|---|---|---|
| RSI | Detects overbought and oversold areas | Leading | Can produce false signals in sideways markets |
| MACD | Confirms trend and momentum | Lagging | Reacts late to price reversals |
| Bollinger Bands | Measures volatility | Lagging | Does not show a definite trend direction |
| Moving Average | Identifies trend direction | Lagging | Lags behind current price movement |
| Stochastic | Measures closing momentum | Leading | Becomes noisy when volatility is high |
This table is only a summary, not a single recommendation. Pick indicators that match your style and trading target.
Checklist Before You Use an Indicator
Answer these questions before you place a trade so that your decision stays structured.
1. Define your trading style: Choose indicators that fit your timeframe and realistic profit target.
2. Test with historical data: Use backtesting or a demo account to gauge how often signals work.
3. Add extra filters: Combine signals with support and resistance, volume, or candlestick patterns.
4. Set the stop-loss first: Never open a position without a clear exit plan.
5. Review regularly: Keep a trading journal so you can evaluate which indicators actually improve results.
Understanding one indicator deeply is better than knowing ten indicators superficially. Start small, keep records, and improve from real results.
Conclusion
Trading indicators help you turn raw price data into easier-to-read signals, but they are not the only source of truth. Every indicator has a function, a benefit, and a limitation that you must understand before using it. A disciplined trader combines indicators with market phase analysis and risk management, instead of collecting tools without a strategy. Begin with one or two indicators, test them in different conditions, and then build a system that fits your own style.
FAQ
What is the best trading indicator for beginners?
Beginners should start with a moving average to read the trend direction and RSI to identify overbought or oversold areas. Use a daily or 1-hour timeframe first, then add MACD after you can read the basic signals consistently.
Can trading indicators guarantee profits?
No indicator can guarantee profits because all of them read historical data, not the future. Sudden trend changes can still cause losses, so always use a stop-loss and position sizing.
How do I avoid false signals from indicators?
Use confirmation from two indicators with different functions, such as RSI for momentum and moving average for trend. Add volume or price structure filters before taking a trade.
What is the difference between leading and lagging indicators?
Leading indicators try to anticipate price reversals, such as RSI and stochastic. Lagging indicators confirm trends that have already started, such as moving averages and MACD. Many traders combine the two to filter signals.
How many indicators should I use at the same time?
Two to three indicators with different roles are enough, such as one trend tool, one momentum tool, and one volume tool. Using too many indicators often creates conflicting signals and slows down decisions.
Start with Mobee
Mobee is a digital asset platform licensed and supervised by OJK, helping users explore crypto and investment products with clearer access and practical learning. Start your investment journey through Mobee and choose products that match your goals and risk profile.
 Direct market access from the app
 Start exploring digital assets with Mobee
Track the market, learn about digital assets, and start trading more conveniently with the Mobee App.
Mobee is licensed and supervised by the OJK. Not a solicitation to buy or sell any asset.