Michael Saylor’s company, Strategy Inc. (formerly MicroStrategy), has redefined its corporate identity by pivoting almost entirely to Bitcoin. With more than 636,000 BTC valued at around $70.6 billion, the firm has entered the Bloomberg 500 and emerged as the largest corporate Bitcoin holder globally. This aggressive strategy now puts the company within striking distance of the S&P 500, a move that could reshape institutional exposure to Bitcoin.
Strategy’s transformation has not only been symbolic but also financial. In Q2 2025, the firm reported $14 billion in operating income, $10 billion in net income, and $32.60 in EPS, largely driven by updated accounting methods for its crypto holdings. Meeting all technical requirements—U.S. listing, market capitalization, profitability, sufficient public float, and trading volume—Strategy appeared well-positioned for S&P 500 inclusion. Analysts suggested that joining the index could trigger as much as $16 billion in passive inflows, indirectly making many institutional investors Bitcoin holders.
Despite satisfying eligibility criteria, the Strategy was excluded from the S&P 500, with Robinhood unexpectedly securing inclusion instead. The decision underscored the cautious stance of the index committee toward companies whose valuations rely heavily on Bitcoin’s volatility. Even so, speculation remains strong: some analysts project a 91% probability of eventual inclusion, provided that Bitcoin’s price holds above the critical $95,000 threshold.
If Strategy eventually joins the S&P 500, the implications would be profound. Passive index funds, retirement accounts, and ETFs would gain indirect Bitcoin exposure, accelerating mainstream adoption. For Saylor, this represents a validation of his vision to make Bitcoin the core of corporate treasury management. However, critics warn that the company’s reliance on debt and equity financing to fuel Bitcoin purchases poses long-term sustainability risks. Shareholder value may become increasingly tied to Bitcoin’s price swings, creating significant upside potential but also heightened vulnerability.
BTC Technical Analysis
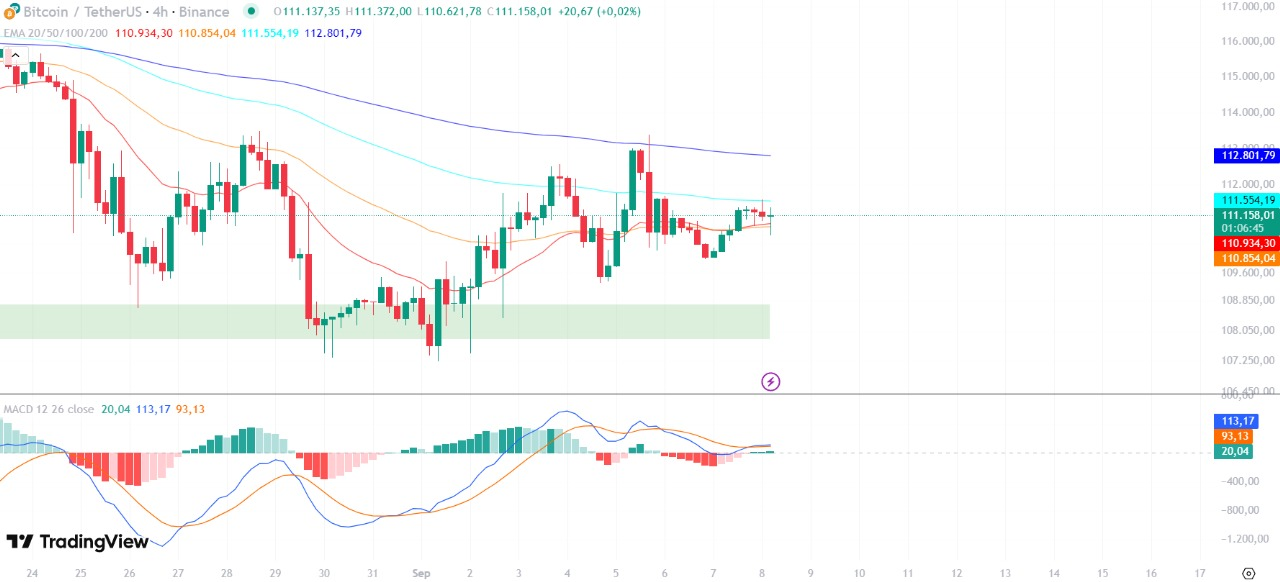
BTC has recently tested the $110,934 support level and is showing a slight recovery, trading above the 20 & 50 EMA but still below the 100, and 200 EMAs. The overall trend remains bearish with a lower-high, lower-low structure, though the MACD indicates a potential weakening of bearish momentum with a recent crossover.
- Structure: Bearish (LH/LL)
- EMA: Above 20, below 50/100/200 = momentum mixed
- MACD: Bearish, but showing signs of reversal
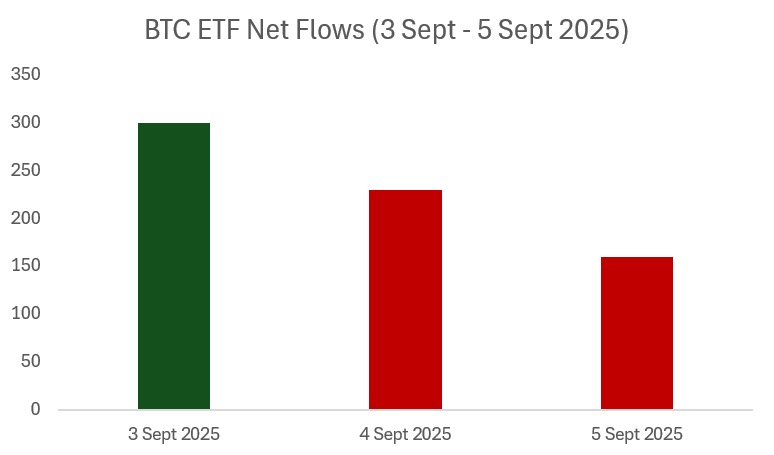
Between September 3 and September 5, 2025, Bitcoin ETFs recorded net flows of $300.5 million, –$222.9 million, and –$160.1 million. The strong initial inflow underscored renewed appetite, but the subsequent back-to-back outflows showed hesitation among investors. This mixed pattern underscores the tug-of-war between bullish positioning and profit-taking.
Overall, the data points to ongoing volatility, where consistent inflows will be key to reestablishing momentum and supporting a sustained BTC rebound.
ETH Technical Analysis

ETH is holding near the 200 EMA at $4,302 within a descending triangle pattern, with lower highs indicating bearish pressure. It remains under the 20, 50, and 100 EMAs, and the MACD continues to show bearish momentum, though it is flattening, suggesting possible indecision.
- Structure: Neutral-bearish (descending triangle)
- EMA: Below 20/50/100, on 200 support
- MACD: Bullish, but momentum is weak
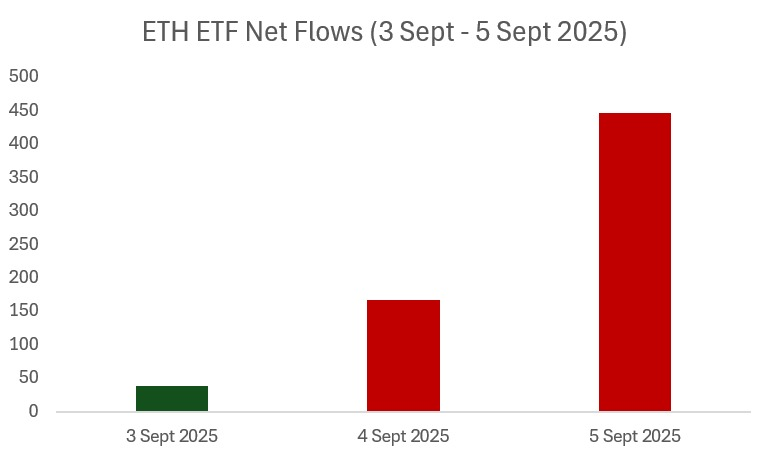
Between September 3 and September 5, 2025, Ethereum ETFs recorded net flows of $38.2 million, –$167.3 million, and –$446.8 million. The brief inflow was quickly overshadowed by consecutive outflows, indicating weakening investor conviction. The accelerating withdrawals highlight persistent caution, suggesting ETH still faces headwinds despite broader market optimism.
Overall, the trend reflects a fragile sentiment where sustained outflows may pressure ETH’s price trajectory unless demand recovers.
SOL Technical Analysis
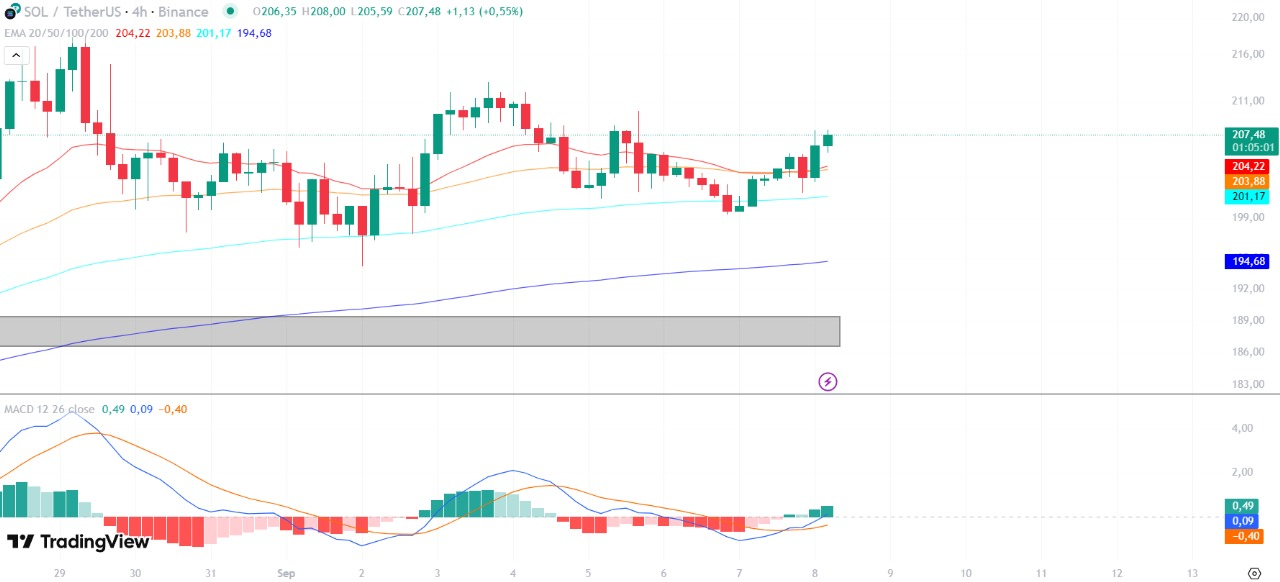
SOL has rebounded from the $194–$196 demand zone, trading above the 20, 50, and 100 EMAs with a higher-low forming, indicating a bullish reversal. The MACD confirms bullish momentum with a fresh crossover, though it is still below the 200 EMA.
- Structure: Bullish reversal (HL forming)
- EMA: Above 20/50/100/200
- MACD: Bullish crossover, momentum rising
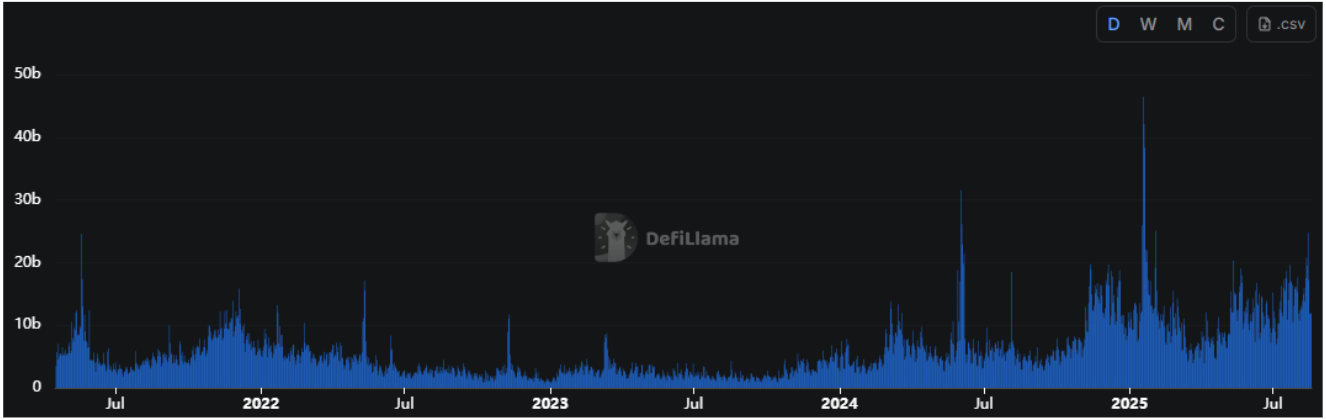
The latest data shows that DEX trading volume remains elevated in 2025 compared to prior years, but has eased off from the sharp spikes seen earlier this year. While activity remains well above 2023 levels, the recent moderation signals a cooldown in trading momentum, suggesting that participants are becoming more selective in deploying liquidity within the decentralized ecosystem.
Disclaimer:
This material is for general information and is not investment advice, a recommendation, or a solicitation to buy and sell any cryptocurrencies, digital assets, securities, or derivative instruments, or to make any investments. Any opinions or estimates are the best judgment of the research team as of the date of preparation and are subject to change without notice. Mobee is not obligated to update this report based on information and events that occurred after this report was created and published. Any suggestions or recommendations in this report may not be appropriate for certain users.