How to Analyze Crypto for Beginners: 3 Methods & Example
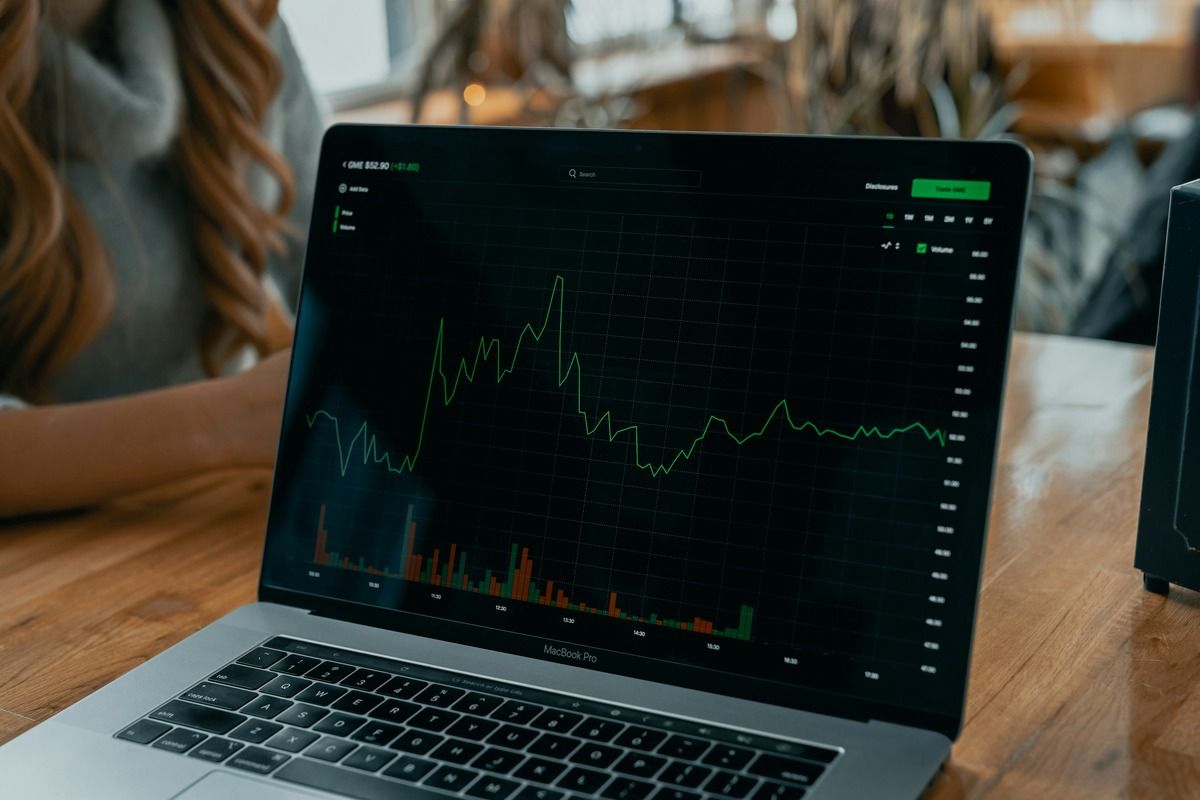
How to analyze crypto comes down to three methods. Fundamental analysis judges project quality, on-chain analysis reads activity on the blockchain, and technical analysis reads the price chart. Use fundamentals to choose an asset, on-chain to understand holders, and technical to time entries and exits. No method guarantees results.
Key Points
- There are three ways to analyze crypto: fundamental (judging the project), on-chain (reading blockchain data), and technical (reading the price chart).
- Each method answers a different question, so beginners usually combine them rather than rely on one.
- No analysis method guarantees profit or accurate predictions. Losses are still possible, including all of your funds.
- This page is an overview. In-depth coverage of each method is in the dedicated articles linked below.
How to Analyze Crypto in One Table
| Method | Question it answers | Example metrics |
|---|---|---|
| Fundamental analysis | Does this project have real use and long-term value? | The problem it solves, the team, tokenomics (total supply and token release schedule), adoption |
| On-chain analysis | What is actually happening on the blockchain: who holds and moves the asset? | Active addresses, flows into and out of exchanges, holder concentration |
| Technical analysis | Where is the price now and how is its momentum? | Support and resistance, volume, RSI, MACD, moving averages |
The terms in the table are explained in the sections below.
How to Analyze Crypto with 3 Methods
These three methods are not either-or choices. Think of them as three lenses: each shows a different side of the same asset.
1. Fundamental Analysis: Judging Project Quality
When to use it: when you are choosing which asset is worth studying further. This method answers "what is this project worth?", not "when should I get in?".
Fundamental analysis asks whether a crypto asset has a reason to hold value over the long term. What is usually checked:
- Use case. What problem does the project solve, and who uses it? If you cannot explain it in one sentence, you do not understand it well enough yet.
- Team and transparency. Is the team open about its identity and track record? An anonymous team is not automatically bad, but you have to judge the risk yourself.
- Tokenomics. This is token plus economics, the rules of a token's supply: total supply, who holds it at the start, and when new tokens are released to the market. Large releases can add selling pressure.
- Adoption and ecosystem. How active the apps, community, and partners using the project are.
- Risks. Competition, regulation, and dependence on a single party.
The limitation: a good project story does not guarantee the price rises, and the price often moves earlier or later than the story.
The full discussion is in crypto fundamentals: how to assess an asset before buying. For a complete research framework, see also DYOR: meaning, steps, and examples.
2. On-Chain Analysis: Reading Activity on the Blockchain
When to use it: when you want to understand holder behavior and asset flows that are not visible on the price chart. The data is public on the blockchain, but interpreting it takes care.
A blockchain records every transaction in the open, so you can see what happens behind the scenes. Some metrics that are often read:
- Active addresses. The number of wallet addresses that transacted in a given period. A rising number can signal growing usage.
- Flows into and out of exchanges. Large inflows to exchanges are sometimes read as preparation to sell, and large outflows as preparation to hold. This is only a hint, not a certainty.
- Holder concentration. If a handful of addresses hold a very large share, one address moving can shake the price.
- Contract activity. How often the application built on that blockchain is used.
The limitation: one address is not necessarily one person, and labels such as "whale" (a large holder) are not always accurate. On-chain numbers are most useful as comparison material, not as a single signal.
The full discussion is in on-chain analysis for beginners. To check transactions directly, read how to use a blockchain explorer.
3. Technical Analysis: Reading the Price Chart
When to use it: when you are weighing entry, exit, and loss limits. This method reads past price and volume patterns. It does not guarantee the next move.
Technical analysis starts from the idea that a price chart records market behavior. The basic tools:
- Candlesticks. A single bar that summarizes the open, high, low, and close in one period.
- Support and resistance. Support is a price area that has often held back declines, and resistance is an area that has often held back rises. Neither is a sure wall.
- Volume. The amount of the asset traded. A price move with large volume is usually seen as more meaningful than one with thin volume.
- Moving average. The average price over a set period, used to see the general direction.
- RSI (Relative Strength Index). A momentum indicator on a scale of 0 to 100. By common convention, a reading above 70 is read as overbought and below 30 as oversold. That is a convention, not a rule.
- MACD. An indicator that compares two moving averages to show changes in momentum.
The limitation: indicators are calculated from past data, so they can lag or give false signals. Sudden news can break a pattern that looked tidy.
The full discussion is in crypto technical analysis: indicators and how to use them. The basics of reading price levels are in support and resistance, and the basics of reading candle shapes are in candlestick patterns.
An Example Analysis Flow from Start to Decision
Imagine you are interested in a token. This is an illustration of the flow, not a recommendation to buy any asset.
- Start with fundamentals. Write in one sentence what problem the project solves and who uses it. Check the token release schedule (tokenomics), because large releases can add selling pressure. If you cannot explain it, stop here.
- Check on-chain data. See whether network activity and the number of holders are growing, and whether a handful of addresses hold a very large share. This data helps judge risk. It does not forecast the price.
- Read the chart. Mark the nearest support and resistance levels, then see whether volume and momentum agree with your story.
- Set your risk before you buy. Decide how much you are ready to lose and at what level you admit your scenario was wrong.
- Record your reasons and review. Write down why you got in. When the price moves, compare it with that note, not with your emotions.
If the three methods give conflicting signals, that is information too: it means you do not yet have enough conviction.
Comparing the 3 Methods of Crypto Analysis
| Aspect | Fundamental | On-chain | Technical |
|---|---|---|---|
| What it looks at | Project quality and tokenomics | Activity and holders on the blockchain | Price, volume, and momentum |
| Time horizon | Medium to long | Short to long | Short to medium |
| Strength | Understanding why you hold an asset | Seeing real behavior, not just stories | A framework for entry, exit, and loss limits |
| Limitation | A good story does not automatically move the price | Data can be misread, one address is not one person | Based on past data and prone to false signals |
| Best for | Choosing which assets deserve study | Judging holder risk and asset flows | Timing entries and exits |
| Combined | Combining all three reduces blind spots, but does not remove risk and does not guarantee results |
Tips for Applying Crypto Analysis with Discipline
- Write your reasons before you buy. A short note helps you judge the decision honestly later.
- Set your loss limit first. Decide the level that makes you exit, and do not move it out of hope.
- Use money you can afford to lose. Crypto assets can fall sharply, so do not use money you need for everyday expenses.
- Do not pile on indicators. Two or three indicators you understand are worth more than ten you copied.
- Cross-check more than one source. Price, volume, and on-chain data can differ between platforms.
- Watch out for FOMO. FOMO (fear of missing out) is the fear of being left behind that makes people buy because it is crowded, not because of research. Learn about crypto trading psychology.
- Review regularly. Compare your notes with the outcome, then improve the process, not only the result.
A guide to carrying out decisions is in crypto trading tips for beginners, and how to balance risk is in crypto trading risk management.
Learn Each Method in Depth
This page gives the big picture of the three methods. For detail, read the dedicated articles below according to what you need:
- Choosing assets and judging projects: crypto fundamentals and DYOR.
- Reading blockchain data: on-chain analysis and blockchain explorer.
- Reading charts and indicators: crypto technical analysis, support and resistance, and candlestick patterns.
- Carrying out decisions: crypto trading tips for beginners and crypto trading risk management.
Practice Crypto Analysis on Mobee
Mobee is operated by PT CTXG Indonesia Berkarya, which is licensed and supervised by OJK. You can open an asset page such as BTC/IDR to see the price chart and follow its movement while you practice reading levels and volume. Start with a small amount, and remember that crypto prices can fall. Don't have the app yet? Install the Mobee App to get started.
Conclusion
A sensible way for beginners to analyze crypto is to understand the three methods and when to use each: fundamental to judge the project, on-chain to read activity on the blockchain, and technical to read the price. The three together give a fuller picture than any one method, but they do not remove risk.
No analysis guarantees profit. Set a loss limit before you buy, use money you can afford to lose, and learn each method through the dedicated articles above.
FAQ
How do I analyze crypto as a beginner?
Learn the three methods first: fundamental analysis to judge the project, on-chain analysis to read activity on the blockchain, and technical analysis to read the price chart. Beginners can start with fundamentals to understand the asset they are interested in, then learn to read basic charts. Practice with a small amount whose risk you can afford.
What is the difference between fundamental, on-chain, and technical analysis?
Fundamental analysis asks whether a project has real use and long-term value. On-chain analysis reads what holders and addresses are doing on the blockchain. Technical analysis reads past price and volume to judge momentum and levels. Each answers a different question, so they work best as complements.
Does crypto analysis guarantee profit?
No. No analysis method guarantees profit or accurate predictions. Analysis helps you make decisions with data, but the price can move against your analysis because of news, market sentiment, and unexpected factors. Losses are still possible, including all of the funds you use.
Which crypto analysis method suits beginners best?
There is no single best method. Fundamental analysis helps you understand a project's value, technical analysis helps you read price movement, and on-chain analysis helps you see holder behavior. Many beginners start with fundamentals and basic technical analysis, then add on-chain once they are comfortable.
Do I have to use all three methods at once?
No. Each method answers a different question, so combining them can reduce blind spots. But combining methods does not automatically make the result right, and decisions still need a clear loss limit.
Where can I find data for crypto analysis?
For fundamental analysis, start with a project's official documentation and whitepaper. For on-chain analysis, use a blockchain explorer and blockchain data platforms. For technical analysis, use price and volume charts from a trading platform or charting tool. Cross-check more than one source, because data can differ and can change.
Disclaimer
This article is for education only and is not investment advice, a recommendation to buy or sell any asset, or financial advice. Fundamental, on-chain, and technical analysis do not guarantee profit or accurate predictions. Crypto assets are high-risk and you can lose all of your funds. Mobee is operated by PT CTXG Indonesia Berkarya, licensed and supervised by the Indonesian Financial Services Authority (OJK).
 Direct market access from the app
Start exploring digital assets with Mobee
Track the market, learn about digital assets, and start trading more conveniently with the Mobee App.
Mobee is licensed and supervised by the OJK. Not a solicitation to buy or sell any asset.