
Trump‑EU Tariff Deal Ushers Rally in Stock Futures, Markets Brace for Busy Week
U.S. stock-index futures climbed sharply after President Donald Trump and European Commission President Ursula von der Leyen struck a new trade framework on July 27, 2025, featuring a 15% tariff on most EU exports to the U.S.—dramatically lower than previous threats of up to 50% and enough to avert what many feared could become a catastrophic transatlantic trade war.
S&P 500 futures rose about 0.4%, Nasdaq futures gained 0.5%, and European futures spiked nearly 1%, while the euro strengthened against the dollar amid improved sentiment. Investors also drew confidence from the framework’s commitment to large-scale European purchases of U.S. energy and military goods and hundreds of billions in investments, which analysts hailed as another strategic win for Trump’s “art of the deal” approach. The move followed earlier trade deals with Japan and others and seems aimed at signaling a pivot from aggressive tariff rhetoric toward dealmaking.
As markets rebound, traders are bracing for this week’s key events: the Federal Reserve and Bank of Japan policy meetings, a flood of earnings from megacap U.S. firms like Apple, Microsoft, Meta, and Amazon, and the resumption of U.S.-China trade talks in Stockholm under a looming August 1 tariff deadline . While the deal eases short-term downside risks, economists continue to warn about potential inflationary effects and the uncertainty around whether this U.S.-led tactic of combining limited tariffs with reciprocal investment incentives can be sustained long-term.
Trump Targets BRICS Allies with 10% Tariff Threat, Global Trade Tensions Intensify
U.S. President Donald Trump has reignited global trade tensions by threatening to impose an additional 10% tariff on countries seen as aligning with the “Anti-American policies of BRICS.” The move was announced via a Truth Social post—it comes amid the ongoing BRICS summit and is widely interpreted as a direct response to the bloc’s growing ambition to reshape global financial governance and reduce dependence on the U.S. dollar.
President Trump declared that “any country aligning themselves with the Anti-American policies of BRICS will be charged an additional 10% tariff. There will be no exceptions to this policy.” However, the lack of clarity on what constitutes such "alignment" has unsettled several U.S. trading partners, leaving open the possibility of sweeping enforcement based on subjective or political interpretations. This ambiguity adds a layer of uncertainty for global supply chains already navigating post-pandemic disruptions and inflationary pressures.
This announcement also comes as new tariff measures, first introduced in April, are due to take effect on August 1, following an extended 90-day pause. Trade partners are bracing for country-specific tariff notifications, set to begin rolling out Monday, adding to the sense of urgency and unpredictability in the global economic landscape.
The broader implication of Trump’s move appears aimed at countering BRICS’ growing influence, particularly as the bloc pushes forward with de-dollarization efforts and alternative financial institutions. Analysts warn that these escalating protectionist policies could accelerate a fracture in global trade alliances, reduce investor confidence, and drive volatility across markets. For cryptocurrencies, such geopolitical friction can create a mixed environment—some investors may view digital assets as hedges against systemic risk, while others may retreat from risk-on positions due to broader macroeconomic instability.
BTC Technical Analysis
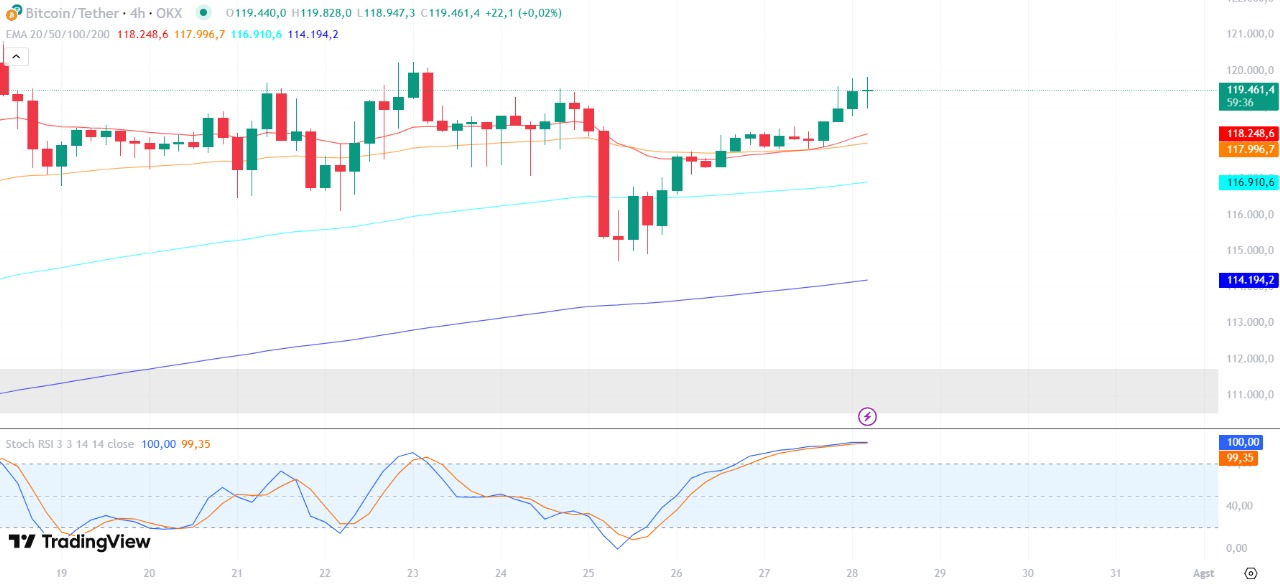
BTC is currently trading around $119,368. This represents a steady upward movement, following a period of consolidation around the $115,000–$120,000 range between July 21 and 28.
BTC is trading above the 20 EMA, 50 EMA, 100 EMA, and 200 EMA. This full bullish EMA alignment supports a strong uptrend. The shorter EMAs are sloping upward, showing increasing momentum, while the longer EMAs confirm trend strength.
On the Stochastic RSI (14, 14), BTC is pegged at 97.31, signaling extreme overbought conditions. This suggests a high probability of near-term cooling or a minor pullback. Traders should be cautious of potential exhaustion at current levels unless the price consolidates before continuing upward.
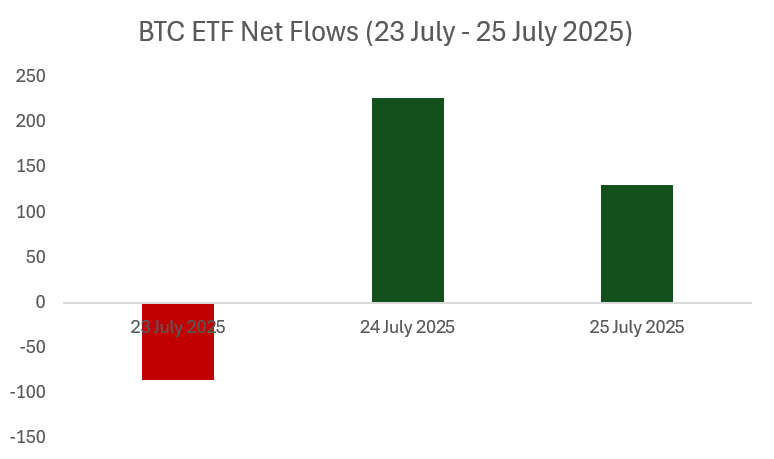
The Bitcoin ETF net flow chart from July 23 to July 25, 2025. After a minor net outflow of $85.8 million on July 23, investor confidence rebounded sharply with an inflow of $226.7 million on July 24, followed by an inflow of $130.8 million on July 25. This rebound signals a renewed, though cautious, interest in Ethereum exposure. The strong spike on July 24 suggests that institutional appetite for BTC remains responsive to market conditions and may continue to support price stability in the near term.
ETH Technical Analysis
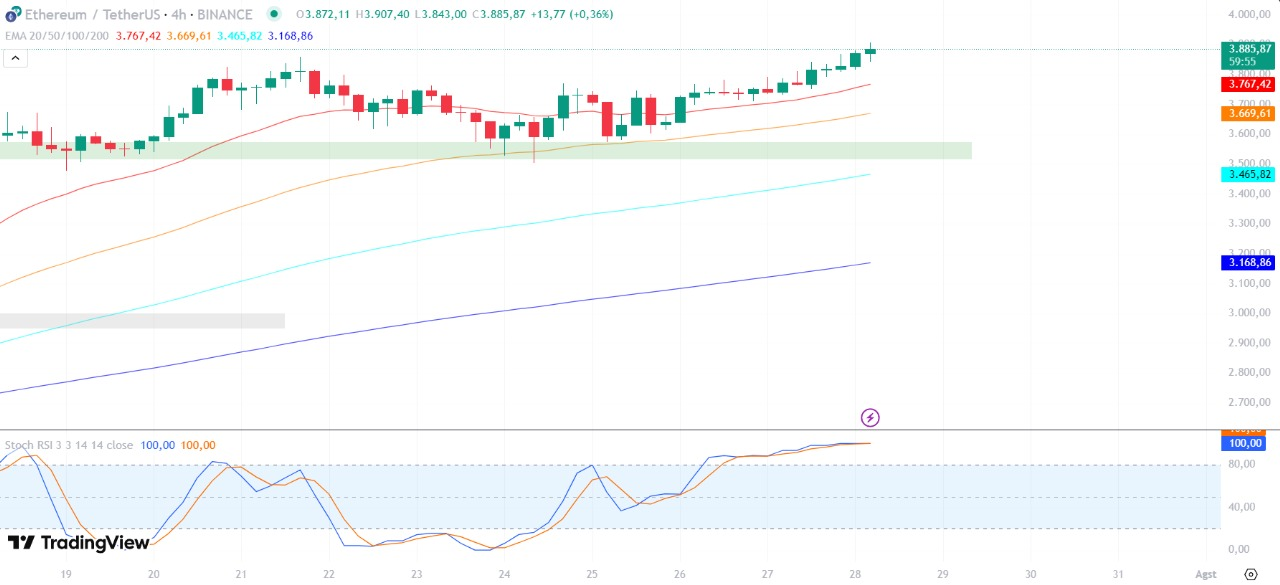
Ethereum is currently trading around $3,885.87, showing a gain of +0.36% from its opening. This represents a steady upward movement, following a period of consolidation around the $3,700–$3,800 range between July 22nd and 26th. The price action has broken above recent highs, indicating potential bullish continuation.
ETH is trading above the 20 EMA, 50 EMA, 100 EMA, and 200 EMA. This full bullish EMA alignment supports a strong uptrend. The shorter EMAs are sloping upward, showing increasing momentum, while the longer EMAs confirm trend strength.
On the Stochastic RSI (14, 14), ETH is pegged at 100.00, signaling extreme overbought conditions. This suggests a high probability of near-term cooling or a minor pullback. Traders should be cautious of potential exhaustion at current levels unless the price consolidates before continuing upward.
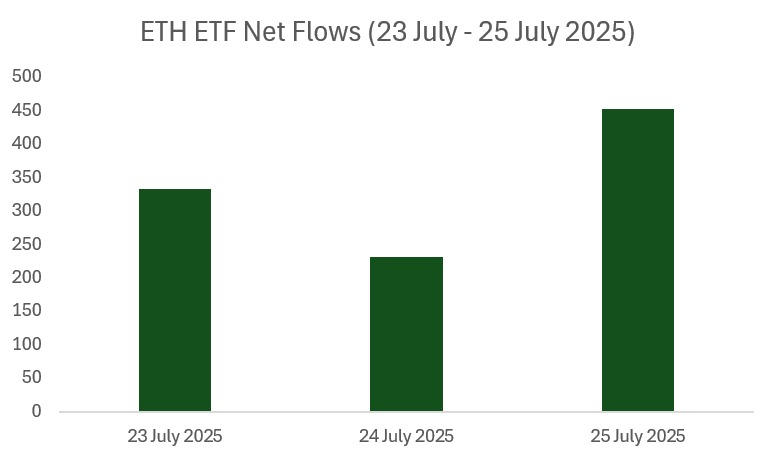
The Ethereum (ETH) ETF net flow chart from July 23 to July 25, 2025, continued to reflect strong institutional interest, with significant inflows of $332.2 million on July 23, $231.2 million on July 24, and $452.8 million on July 25. This steady capital injection has played a key role in supporting Ethereum’s price resilience and sets the stage for potential upside in the near term.
SOL Technical Analysis
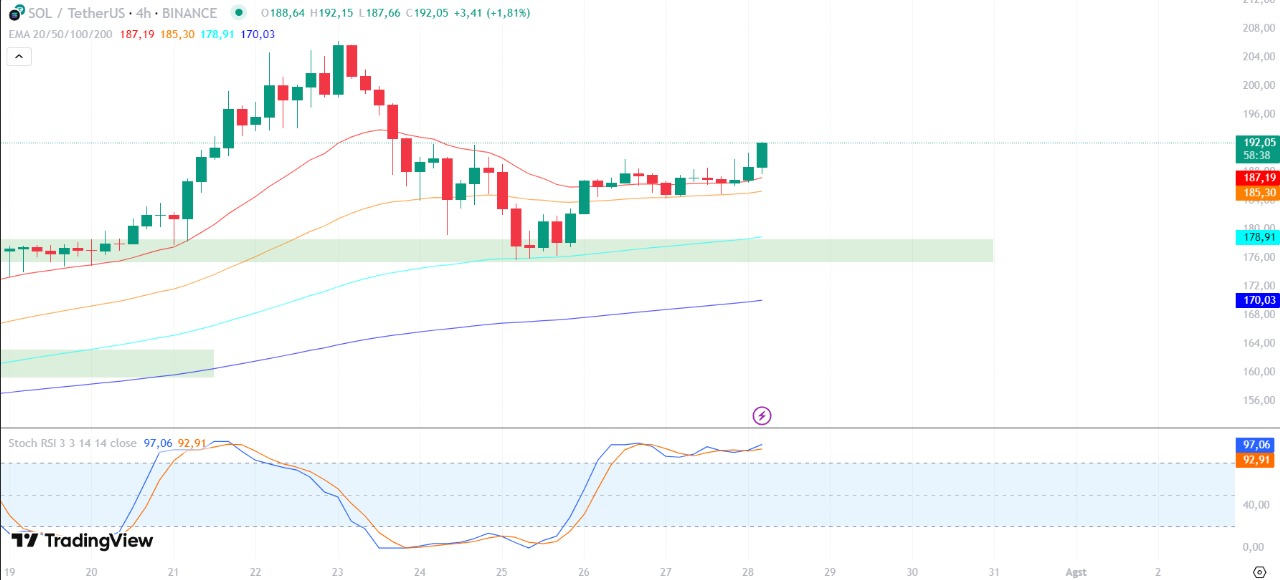
Solana has continued its strong bullish momentum, currently trading at $191.70, showing a gain of +3.17% this week. The chart displays a clear upward trend, with SOL now trading significantly higher than the previous consolidation zone and challenging new highs.
Price is now above all key Exponential Moving Averages (EMAs). The 20 EMA is at $187.19, acting as strong immediate dynamic support. Solana is also trading above the 50 EMA, the 100 EMA, and the 200 EMA. This layered alignment of EMAs, all pointing upwards, confirms a robust uptrend across short, medium, and long timeframes, indicating sustained bullish sentiment.
The RSI (14) has further risen to 97.06. This indicates that Solana has moved into overbought territory, reflecting strong buying pressure and momentum. While this signifies significant demand, traders should be mindful of potential short-term pullbacks or consolidation, as extended periods in overbought conditions can sometimes precede a temporary correction. However, the overall trend remains strongly bullish as long as the price remains above the key EMA levels.
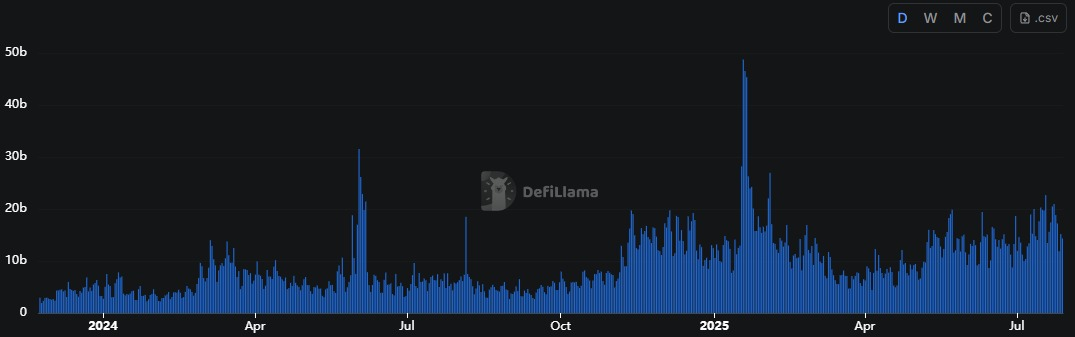
The latest data shows that DEX trading volume has decreased compared to its peak in late 2024. Although still higher than 2023 levels, the recent downtrend suggests cooling market activity and reduced trading momentum in the decentralized space.

.webp)