Weekly Roundup: Major Price Correction in the Crypto Market

Global Market Highlight
The U.S. service sector demonstrated strong growth in December, with the ISM Non-Manufacturing PMI rising to 54.1, exceeding expectations and indicating continued expansion. Input prices surged as the Non-Manufacturing Prices Index reached 64.4, its highest in nearly two years, highlighting rising cost pressures. November's JOLTS Job Openings also jumped to 8.098 million, well above forecasts, bolstering the U.S. dollar and supporting the Fed's higher-for-longer rate stance amid economic resilience.
Labor market data on Wednesday showed mixed results. ADP Nonfarm Employment Change came in weaker than expected at 122,000, below the 139,000 forecast. However, Initial Jobless Claims fell to 201,000, underscoring labor market strength. Crude Oil Inventories decreased by 0.959 million barrels, reflecting a smaller-than-anticipated drawdown. Meanwhile, the U.S. 10-Year Note Auction on January 7, 2025, posted a 4.68% yield, the highest since 2007, reflecting market confidence in a strong economy and lingering inflation concerns.
Friday's employment report revealed a solid increase in Nonfarm Payrolls, which rose by 256,000, beating expectations. The Unemployment Rate dipped slightly to 4.1%, while Average Hourly Earnings growth remained steady at 0.3%, signaling moderate wage gains.
BTC Technical Analysis
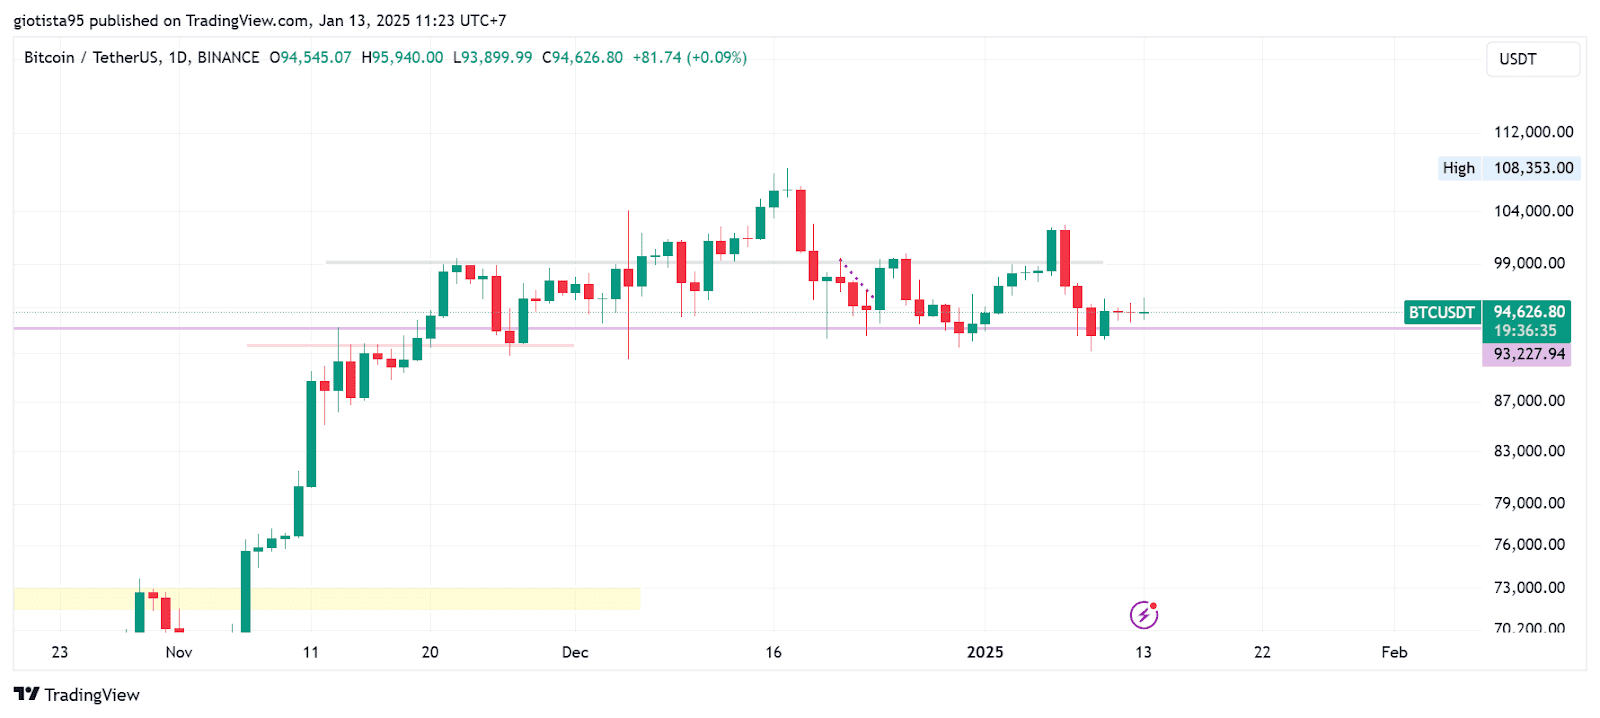
Between January 6th and January 13th, 2025, Bitcoin (BTC/USDT) experienced significant price movements. On January 6th, BTC successfully broke above the resistance level of $99,000, reaching a high of $102,235 before closing at that level. However, on January 7th, the price failed to sustain above $99,000, which had turned into a support level after the breakout. This inability to hold the $99,000 support led to a retracement, pushing the price back into a consolidative range between $93,227.94 and $95,940.
The price action during this period shows market indecision, reflected in the small-bodied candlesticks and low momentum. The trend remains sideways as traders wait for a catalyst to determine the next significant move. A breakout above $95,940 or a breakdown below $93,227 could provide clearer direction.
ETH Technical Analysis
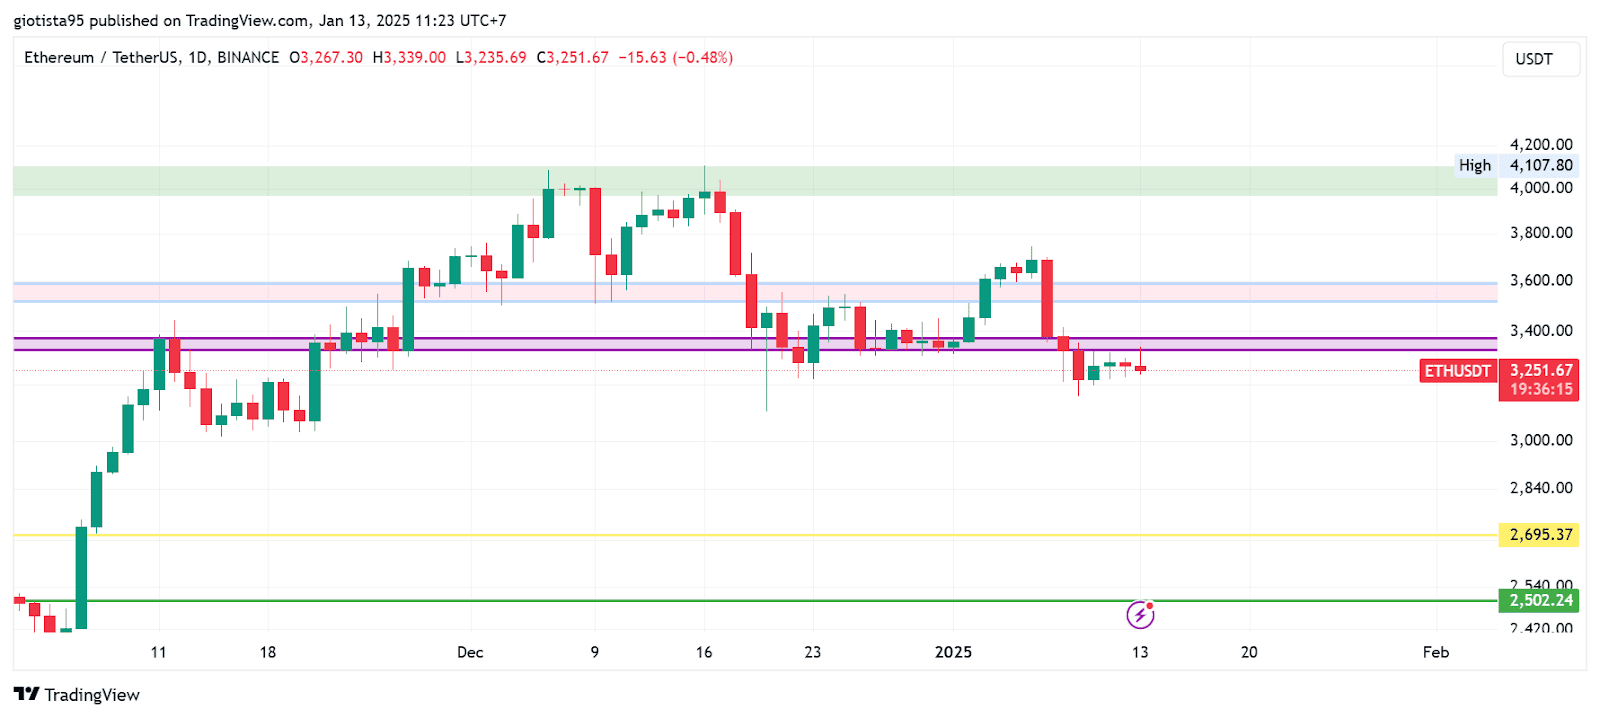
On January 6th, ETH managed to break above the resistance level of $3,591, reaching a high for the day before closing at that level. However, on January 7th, ETH failed to sustain its position above $3,591, which had turned into a support level following the breakout. The situation worsened on January 8th, as ETH also failed to hold its next support range between $3,332 and $3,379. The breach of this support area triggered further selling pressure, causing the price to decline significantly. At the time of writing, Ethereum is trading at $3,251. A breakdown below this level could lead to further declines, potentially targeting $3,000.
SOL Technical Analysis
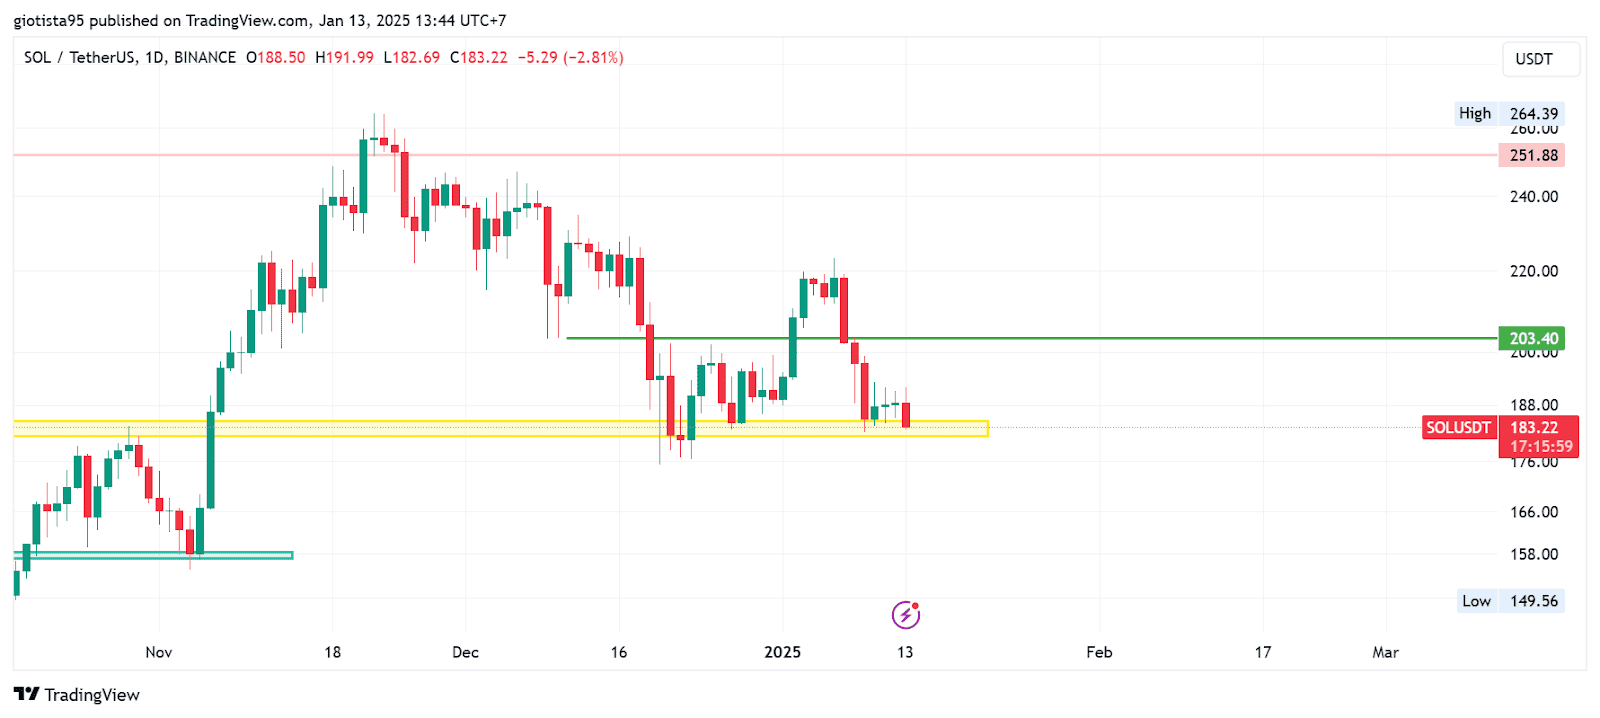
Between January 6th and January 13th, 2025, Solana (SOL/USDT) experienced significant price movements that shifted the market trend. On January 6th, SOL successfully traded above the resistance level of $203.40, indicating a potential continuation of the uptrend. However, on January 7th, the price failed to sustain above this level, marking a reversal from the previous uptrend to a downtrend.
Currently, Solana is consolidating near the key support zone between $181.27 and $184.51. This level is critical for buyers to defend, as maintaining the price above this area keeps the possibility open for a recovery. If the support holds, SOL has a chance to retest the resistance near $200, potentially reigniting bullish momentum. Conversely, a breakdown below the $181.27-$184.51 zone could trigger further declines