Weekly Roundup: Fed Watch, Litecoin ETF Outlook, and Crypto Price Analysis

Global Market Highlight
The April Nonfarm Payrolls report delivered a modest upside surprise, with the U.S. economy adding 177,000 jobs, above market expectations of 130,000, though slightly below March’s upwardly revised figure of 185,000. The unemployment rate held steady at 4.2%, reinforcing the view of a resilient labor market. However, wage growth showed signs of cooling, with average hourly earnings rising just 0.2% month-over-month (versus 0.3% expected), and annual wage growth at 3.8%. This combination of solid job growth and easing wage pressures could ease inflation concerns and strengthen the case for a more dovish stance from the Federal Reserve in the coming months.
Despite this, data from the CME FedWatch Tool shows that markets overwhelmingly expect the Fed to hold rates steady at the current target range of 4.25%–4.50%, with a 95.5% probability. Only 4.5% of market participants are pricing in a rate cut to 4.00%–4.25%. This suggests that investors believe the economy remains strong enough—and inflation persistent enough—to warrant a cautious approach by the Fed. In short, while recent labor data may support a less aggressive policy stance, markets are not yet convinced that rate cuts are imminent.
SEC Delays Decision on Litecoin ETF to June 2025
The U.S. Securities and Exchange Commission (SEC) has postponed its decision on Canary Capital’s proposed spot Litecoin (LTC) exchange-traded fund (ETF), setting a new deadline of June 17, 2025. This move is consistent with the SEC’s cautious stance on crypto ETFs, following similar delays for applications involving assets like XRP, Hedera, and Dogecoin.
Despite the setback, market sentiment remains hopeful. Bloomberg ETF analyst James Seyffart estimates a 90% likelihood of approval by year-end, pointing to Litecoin’s close resemblance to Bitcoin and the SEC’s tendency to treat it as a commodity. Meanwhile, the SEC’s call for public commentary has brought Litecoin’s market structure into focus. Critics have highlighted concerns over the asset’s centralization, noting that roughly 39% of LTC’s total supply is held by just 100 wallets — a concentration that could expose the market to manipulation risks.
BTC Technical Analysis
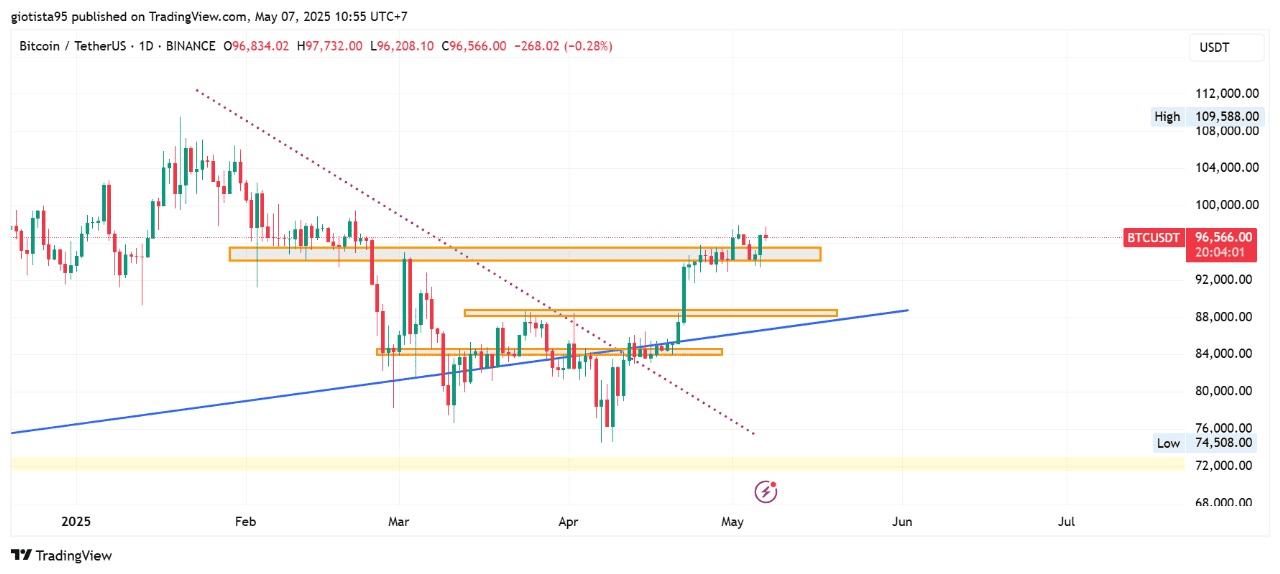
BTC price action has rebounded from the orange zone at the 94,100–95,500 level, which now acts as a solid support area. The upward-sloping blue trendline highlights a broader bullish structure, as Bitcoin has been forming higher lows since mid-March. Along this trend, multiple demand zones have formed, most notably between 88,000–90,000 and 84,000–86,000 USDT, providing potential support in the event of a pullback.
At present, Bitcoin is facing resistance near the 97,000–98,000 range and has yet to break through it decisively. A confirmed breakout above this zone could open the door for a rally toward the psychological 100,000 level. If BTC fails to hold above the 94,000–95,000 support, it may revisit lower support zones around 90,000 or even the trendline near 86,000.
Overall, the structure remains bullish, with the current consolidation near resistance potentially setting the stage for a breakout if buying momentum returns.
ETH Technical Analysis
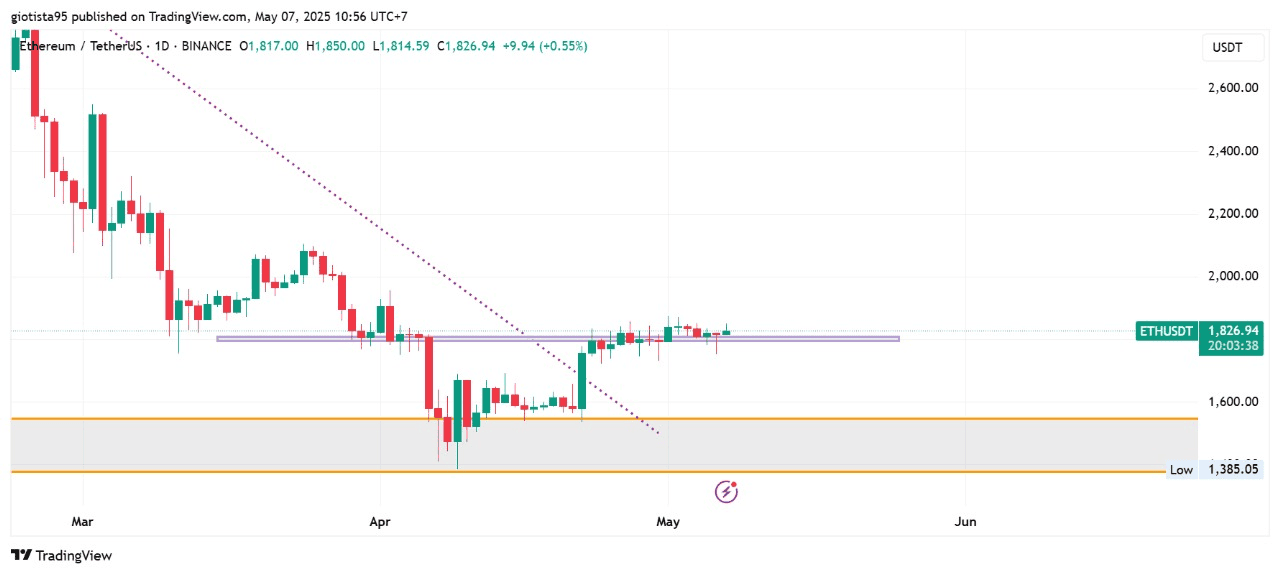
The ETH/USDT daily chart shows Ethereum trading in a tight consolidation zone just above the 1,800 USDT level, which is acting as a short-term support area (highlighted by the purple zone). This follows a breakout from a descending trendline (purple dotted line), indicating a potential shift from bearish to neutral or bullish sentiment.
Despite breaking above the trendline, ETH has not demonstrated strong momentum, instead moving sideways near this key level. This signals indecision in the market, possibly awaiting a catalyst to drive a more decisive move. If price holds above the purple support zone and breaks above the recent highs near 1,850–1,880 USDT, it could confirm a bullish continuation with room to rally toward 2,000 USDT and beyond.
On the downside, a failure to maintain the 1,800 level could expose Ethereum to a drop toward the next major demand zone in the 1,500–1,600 USDT range, which is clearly marked in orange and grey.
SOL Technical Analysis
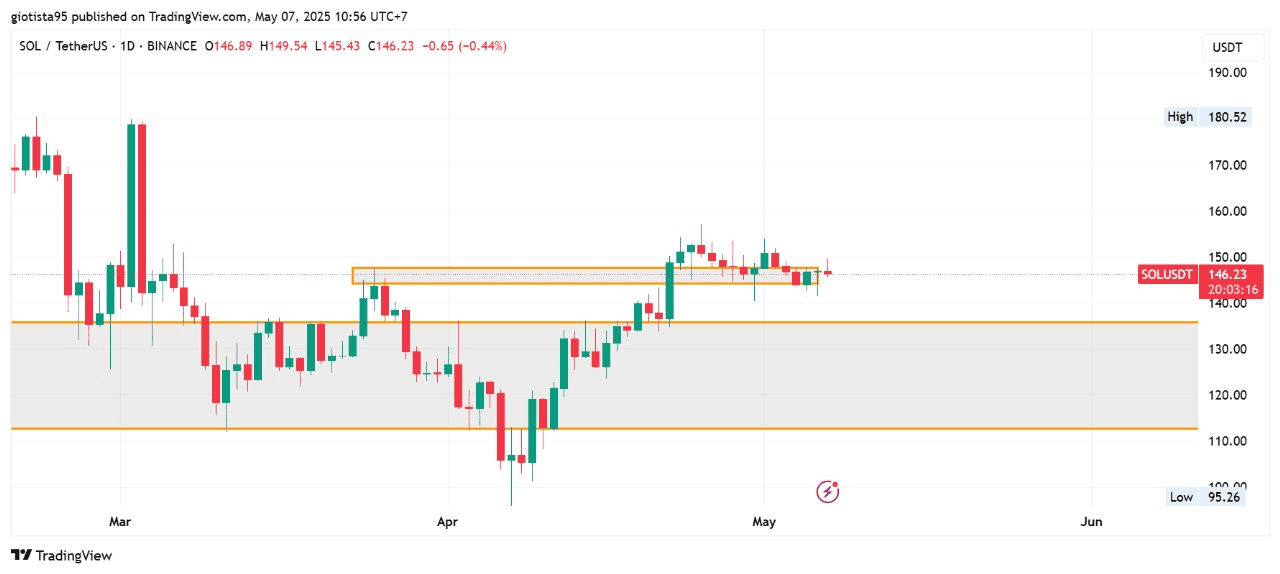
The SOL/USDT daily chart indicates that Solana is currently in a consolidation phase just above a key support-turned-resistance level around $145–$147, marked by the orange box. After recovering from the $120–$130 demand zone (grey area), SOL rallied sharply but now appears to be struggling to sustain momentum above this resistance, with multiple rejections near the $150 level.
A break above the $152 with strong volume could trigger a continuation rally toward the previous high at around $180. Conversely, a failure to hold above $143 could open the path for a retracement back toward the $130–$135 support region.