Weekly-Roundup: Bitcoin ETF Inflows Hit Six-Week High Amid Price Surges

Bitcoin ETF Inflows Hit Six-Week High Amid Price Surges
In the second week of July, Bitcoin ETF flows recorded a positive trend. On July 15, Bitcoin ETF inflows were recorded at $300.9 million. Among the ETFs, IBIT and ARKB saw the highest flows, with each attracting $117.2 million. The following day, Bitcoin ETF inflows reached a six-week high of $422.5 million. IBIT maintained its position as the leading ETF, with an inflow of $260.2 million. On July 17 and 18, Bitcoin ETF inflows were relatively modest, at $53.3 million and $37.2 million, respectively. This decrease in inflows was mirrored by a correction in Bitcoin's price.
On Friday (19/07), Bitcoin ETF inflows surged to $383.6 million, marking a substantial increase. This uptick in inflows was accompanied by a 4.18% rise in Bitcoin's price, reflecting a strong positive correlation between higher investor activity in ETFs and the cryptocurrency's price movement.
Bitcoin Price Analysis
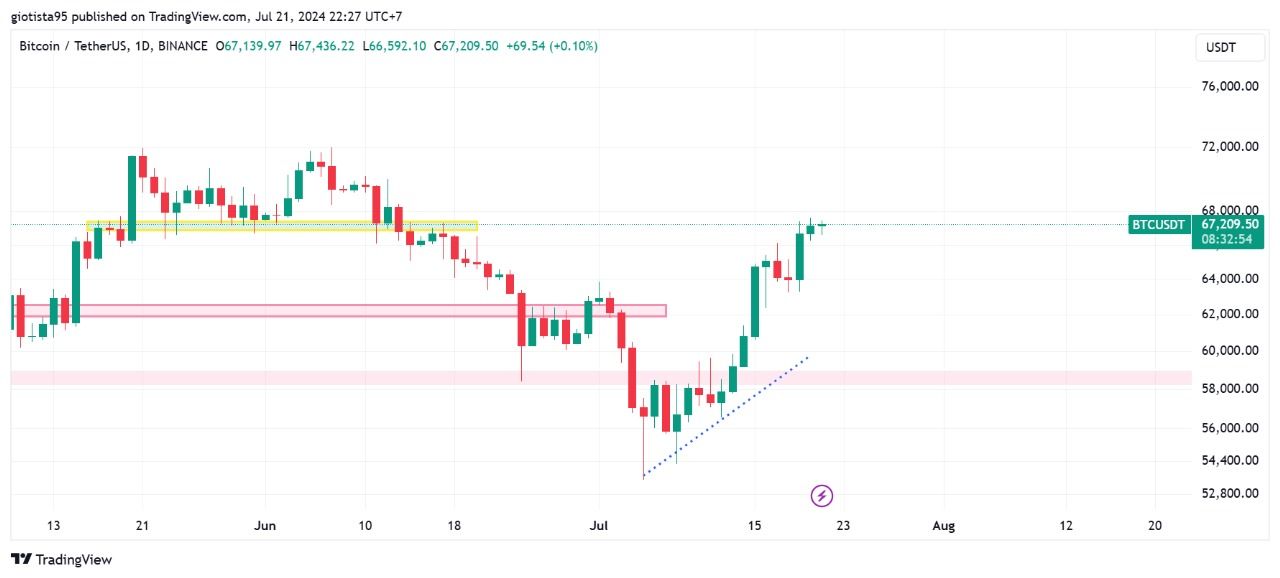
On July 15, the price of BTC saw a significant increase of 6.46%, breaking through the crucial level of $62,000 and closing at $64,724. The next day, July 16, BTC experienced a low of $62,373 but managed to close at $65,042, marking a slight increase of 0.49%. On July 17 and 18, BTC experienced a slight correction but managed to stay above the $62,000 level. This indicates that BTC's movement remains strong and positive.
On Friday, the price of BTC surged significantly, rising by 4.18% and reaching the next resistance level at $67,000. Over the weekend, on Saturday and Sunday, BTC's movement remained strong. By Sunday, July 21, BTC reached its highest level for the month of July, touching $68,000. During July, BTC rose 25% from its lowest point on July 5 and now stands at a resistance level, making it quite vulnerable to profit-taking actions.
Ethereum Price Analysis
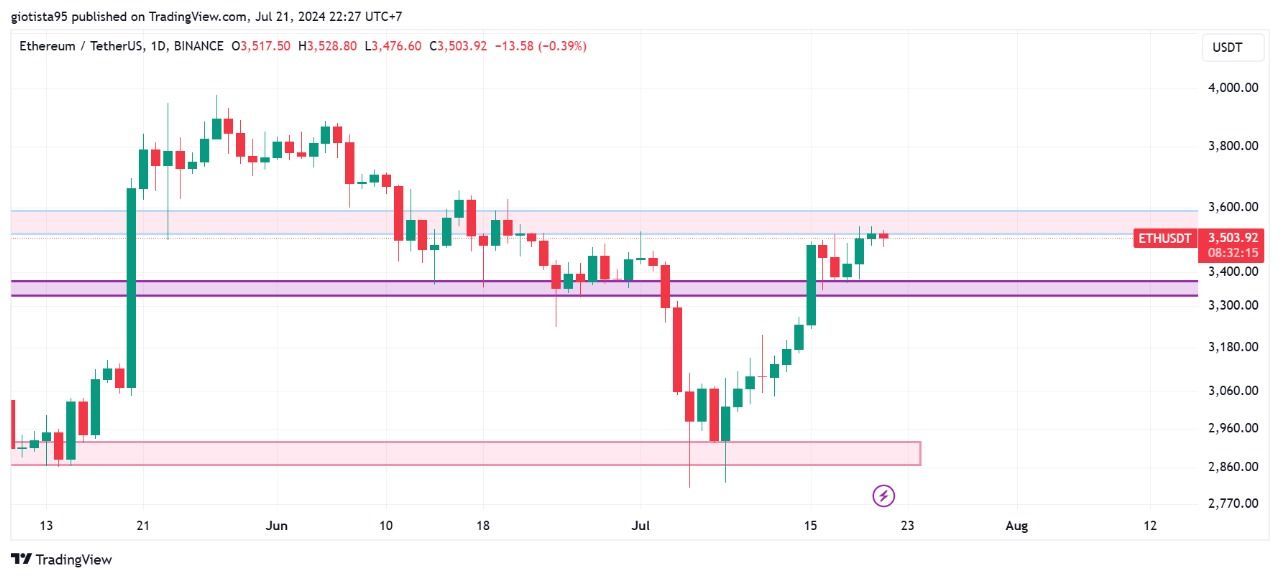
ETH's movement mirrored BTC, with a significant increase of 7.34% on July 15, breaking through the resistance level of $3,400 and closing at $3,483. On July 16 and 17, ETH experienced a correction but managed to stay above the support level of $3,300. This indicates a healthy retracement after breaking the resistance the previous day, maintaining the overall bullish trend.
On July 18, ETH rebounded from its support level, rising by 1.16%. The upward trend continued on July 19 with a 2.25% increase, closing at $3,503. Over the weekend, ETH's price movement was mostly sideways, unable to break the next resistance level at $3,600. On July 23, nine ETH ETFs are set to be traded. This anticipated event is expected to generate positive sentiment, potentially driving ETH's price to break the $3,600 resistance level and reach the next target of $4,000.
Solana Price Analysis
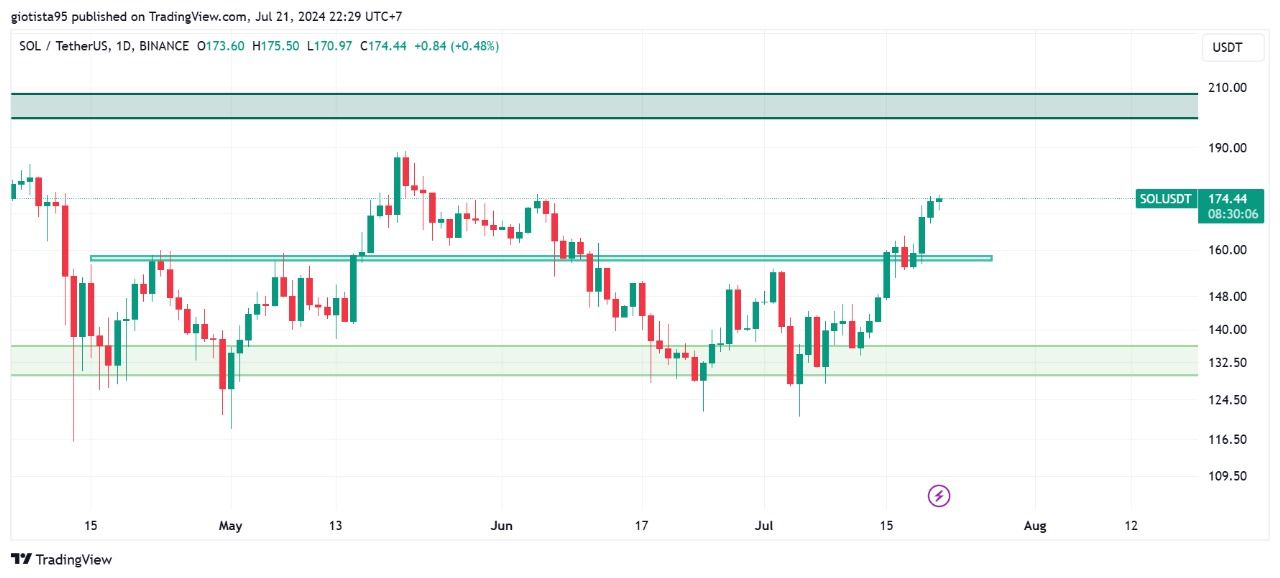
On July 15, Solana displayed a bullish pattern after successfully breaking through its mini resistance at the $147 level. The cryptocurrency experienced a significant increase of 7.94%, quickly surpassing the next resistance level at $158. Following the significant increase, from July 16 to 18, Solana's price retraced to the support area around $158.
The significant movement began on Friday, July 19, after Solana bounced back from the support level, rising by 6.22% in just one day. During the weekend, Solana gradually climbed towards the resistance level at $185. If the price of Solana manages to stay above the $185 level, there is potential for it to rise further up to the $200 level.
Disclaimer
This material is for general information and is not investment advice, a recommendation, or solicitation to buy and sell any cryptocurrencies, digital assets, securities or derivative instruments, or to make any investments. Mobee is under no obligation to update this report based on information and events that occurred after this report was created and published. Any suggestions or recommendations in this report may not be appropriate for certain users.