Weekly-Roundup: Significant Inflows Mark a Volatile Week for U.S. Bitcoin Spot ETFs

Significant Inflows Mark a Volatile Week for U.S. Bitcoin Spot ETFs
Inflow into United States-based spot Bitcoin exchange-traded funds (ETFs) from July 8 to July 12, 2024, showed significant activity. On July 8, the largest inflow was recorded by IBIT, which received $187.2 million, contributing to a total inflow of $294.8 million across all ETFs. On July 9, IBIT again saw the highest inflow with $121.0 million, while BITB experienced an outflow of $4.7 million and GBTC a significant outflow of $37.5 million, resulting in a total inflow of $216.4 million.
On July 10, GBTC stood out with a record outflow of $8.2 million, marking the second consecutive day of significant withdrawals, and the total inflow reached $147.4 million. On July 11, the total inflow into U.S.-based spot Bitcoin ETFs was $78.9 million. Finally, on July 12, the ETFs marked their best-performing day since June 5, with leading inflows from IBIT at $120.0 million and FBTC at $115.1 million, contributing to a total inflow of $310.1 million.
Bitcoin Price Analysis
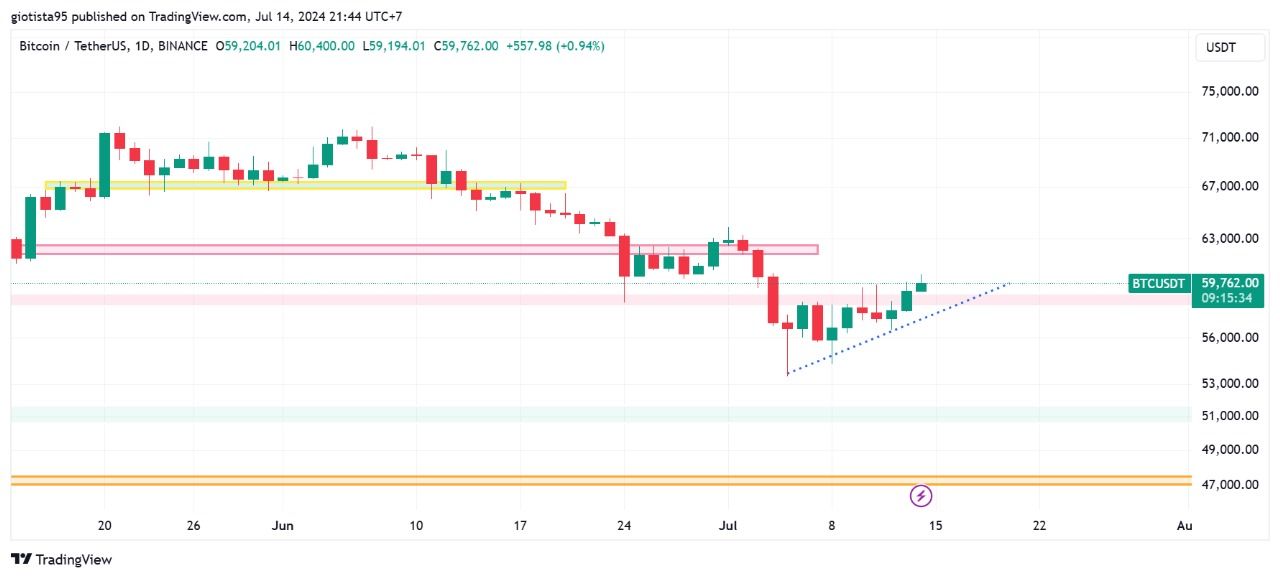
On July 8, the price of Bitcoin was notably volatile. Bitcoin recorded a low of $54,260 and a high of $58,236. Despite significant price fluctuations, Bitcoin managed to close the day with a green candle, reflecting a gain of 1.53%. On July 9, Bitcoin continued its upward trend with a 2.35% increase. However, despite this rise, it still couldn't break through the resistance level.
On July 10, Bitcoin's price briefly broke through the resistance level but failed to close above it. Consequently, Bitcoin's price corrected by 0.56%. The following day, Bitcoin's price movement attempted to break through the resistance level again but failed. This time, Bitcoin closed lower than the previous day's closing price, with a correction of 0.67%.
On July 12, Bitcoin's price was quite volatile, with a low of $56,542 and a high of $58,526. Despite another attempt to break through the resistance level, Bitcoin managed to close the day with a slight positive gain of 0.96%. In contrast to the previous week, this weekend (Saturday and Sunday) saw significant gains as Bitcoin successfully closed above the resistance level. The total increase over these two days was 3.5%.
Bitcoin's price movement is showing a rebound pattern, with a target increase to $62,000 if it can consistently hold above the support level of $59,000.
Ethereum Price Analysis
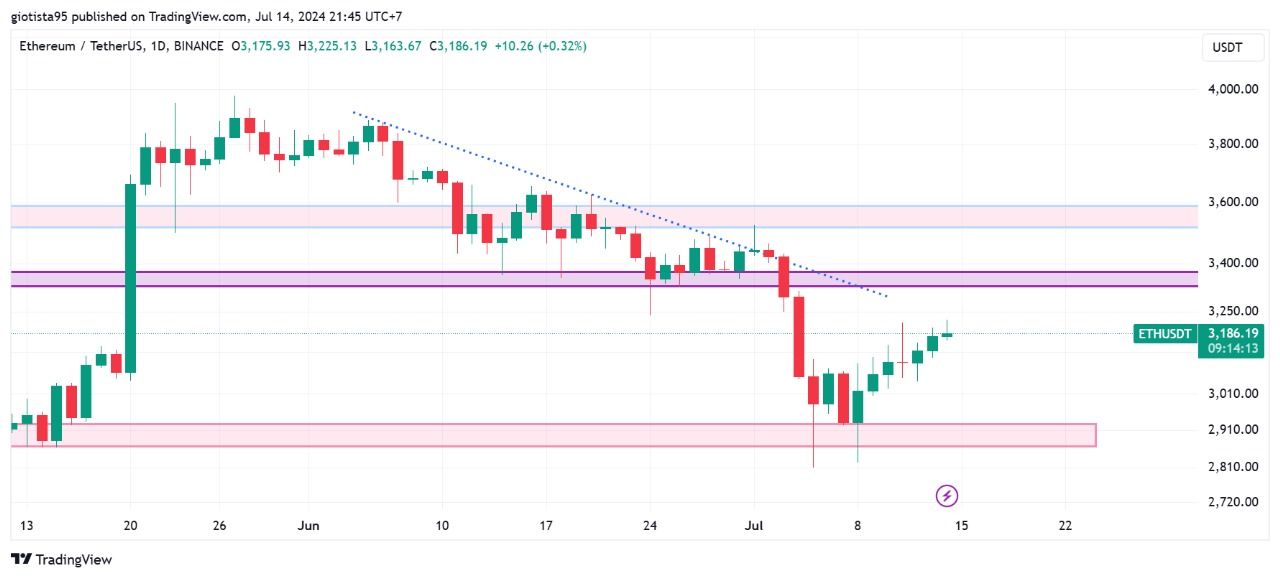
On July 8, Ethereum's price briefly dipped to a low of $2,822 but managed to close above the strong support level of $2,870 - $2,920. By the end of the day, Ethereum recorded a daily gain of 3%. Ethereum's price movement differed from Bitcoin's. After a dip on July 8, Ethereum's price steadily increased over the following days without any significant declines. Based on its current movement, Ethereum is heading towards a price target of $3,300.
Solana Price Analysis
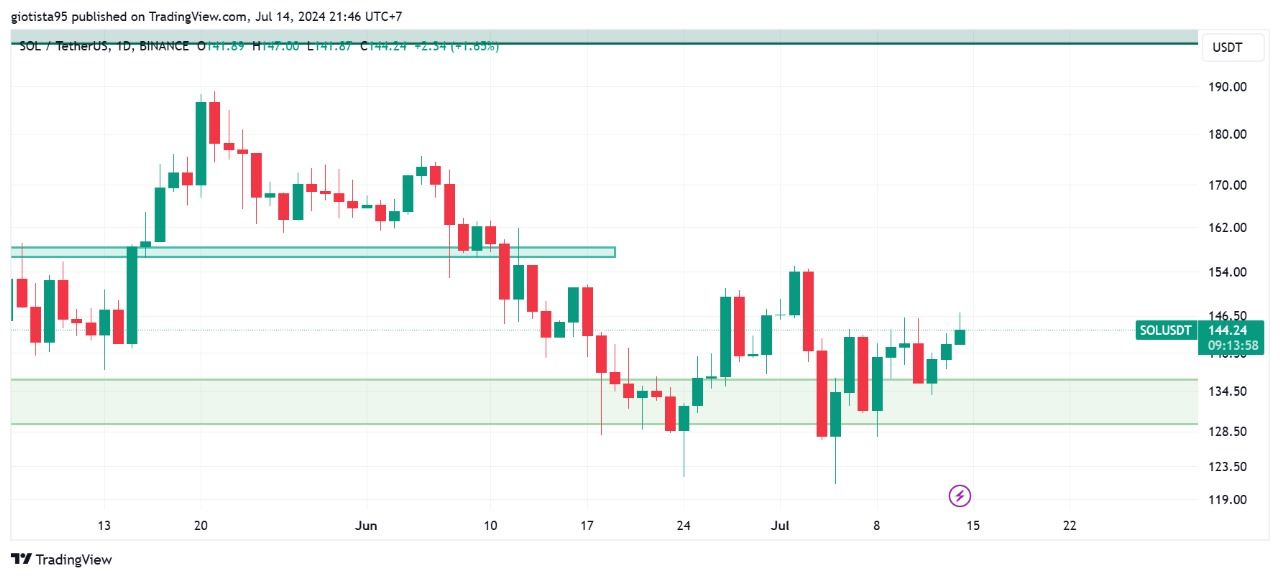
On July 8, the overall crypto market experienced a simultaneous drop. Including Solana, which also saw a decline on July 8. On July 8, Solana's price briefly dropped to a low of $127.77 but managed to rebound and close at $139.81, marking a daily increase of 6.21%. On July 9 and 10, Solana's price slowly climbed, although the path was not without challenges.
On July 11, Solana experienced a correction of 4.4%, but it remained above the support level of $130, indicating a relatively stable position. Afterward, Solana's price gradually rose from Friday, July 12, until the time of writing. Looking at Solana's current price movement, it appears to be heading towards the next target of $154.
Disclaimer
This material is for general information and is not investment advice, a recommendation, or solicitation to buy and sell any cryptocurrencies, digital assets, securities or derivative instruments, or to make any investments. Mobee is under no obligation to update this report based on information and events that occurred after this report was created and published. Any suggestions or recommendations in this report may not be appropriate for certain users.